MetLife 2004 Annual Report Download - page 38
Download and view the complete annual report
Please find page 38 of the 2004 MetLife annual report below. You can navigate through the pages in the report by either clicking on the pages listed below, or by using the keyword search tool below to find specific information within the annual report.-
 1
1 -
2
-
3
-
4
-
5
-
6
-
7
-
8
-
9
-
10
-
11
-
12
-
13
-
14
-
15
-
16
-
17
-
18
-
19
-
20
-
21
-
22
-
23
-
24
-
25
-
26
-
27
-
 28
28 -
 29
29 -
 30
30 -
 31
31 -
 32
32 -
 33
33 -
 34
34 -
 35
35 -
 36
36 -
 37
37 -
 38
38 -
 39
39 -
 40
40 -
 41
41 -
 42
42 -
 43
43 -
 44
44 -
 45
45 -
 46
46 -
 47
47 -
 48
48 -
49
-
50
-
51
-
52
-
53
-
54
-
55
-
56
-
57
-
58
-
59
-
60
-
61
-
62
-
63
-
64
-
65
-
66
-
67
-
68
-
69
-
70
-
71
-
72
-
73
-
74
-
75
-
76
-
77
-
78
-
79
-
80
-
81
-
82
-
83
-
84
-
85
-
86
-
87
-
88
-
89
-
90
-
91
-
92
-
93
-
94
-
95
-
96
-
97
-
98
-
99
-
100
-
101
 |
 |

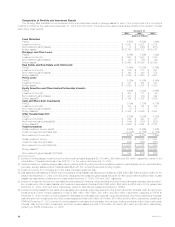
in the real estate joint ventures net of impairments and valuation allowances. The following table presents the carrying value of the Company’s real estate,
real estate joint ventures, real estate held-for-sale and real estate acquired upon foreclosure at:
December 31, 2004 December 31, 2003
Carrying % of Carrying % of
Type Value Total Value Total
(Dollars in millions)
Real estate held-for-investment ******************************************************* $3,592 84.9% $3,193 68.2%
Real estate joint ventures held-for-investment ******************************************* 386 9.1 312 6.7
Foreclosed real estate held-for-investment ********************************************** 3 0.1 2 0.1
3,981 94.1 3,507 75.0
Real estate held-for-sale ************************************************************* 251 5.9 1,169 25.0
Foreclosed real estate held-for-sale**************************************************** 1— 1—
252 5.9 1,170 25.0
Total real estate, real estate joint ventures and real estate held-for-sale ********************** $4,233 100.0% $4,677 100.0%
The Company’s carrying value of real estate held-for-sale, including real estate acquired upon foreclosure of commercial and agricultural mortgage
loans, in the amounts of $252 million and $1,170 million at December 31, 2004 and 2003, respectively, are net of valuation allowances of $4 million and
$12 million, respectively, and net of prior year impairments of $6 million and $151 million at December 31, 2004 and 2003, respectively.
The Company records real estate acquired upon foreclosure of commercial and agricultural mortgage loans at the lower of estimated fair value or the
carrying value of the mortgage loan at the date of foreclosure.
Certain of the Company’s investments in real estate joint ventures meet the definition of a VIE under FIN 46(r). See ‘‘— Investments — Variable
Interest Entities.’’
Other Limited Partnership Interests
The carrying value of other limited partnership interests (which primarily represent ownership interests in pooled investment funds that make private
equity investments in companies in the United States and overseas) was $2,907 million and $2,600 million at December 31, 2004 and 2003,
respectively. The Company uses the equity method of accounting for investments in limited partnership interests in which it has more than a minor
interest, has influence over the partnership’s operating and financial policies and does not have a controlling interest. The Company uses the cost
method for minor interest investments and when it has virtually no influence over the partnership’s operating and financial policies. The Company’s
investments in other limited partnerships represented 1.2% of cash and invested assets at both December 31, 2004 and 2003.
Some of the Company’s investments in other limited partnership interests meet the definition of a VIE under FIN 46(r). See ‘‘— Investments —
Variable Interest Entities.’’
Other Invested Assets
The Company’s other invested assets consist principally of leveraged leases and funds withheld at interest of $3.9 billion at both December 31,
2004 and 2003. The leveraged leases are recorded net of non-recourse debt. The Company participates in lease transactions, which are diversified by
industry, asset type and geographic area. The Company regularly reviews residual values and writes down residuals to expected values as needed.
Funds withheld represent amounts contractually withheld by ceding companies in accordance with reinsurance agreements. For agreements written on a
modified coinsurance basis and certain agreements written on a coinsurance basis, assets supporting the reinsured policies equal to the net statutory
reserves are withheld and continue to be legally owned by the ceding company. Other invested assets also include the fair value of embedded
derivatives related to funds withheld and modified coinsurance contracts. Interest accrues to these funds withheld at rates defined by the treaty terms and
may be contractually specified or directly related to the investment portfolio. The Company’s other invested assets represented 2.1% of cash and
invested assets at both December 31, 2004 and 2003.
Derivative Financial Instruments
The Company uses a variety of derivatives, including swaps, forwards, future and option contracts, to manage its various risks. Additionally, the
Company enters into income generation and replication derivative transactions as permitted by its insurance subsidiaries’ Derivatives Use Plans approved
by the applicable state insurance departments.
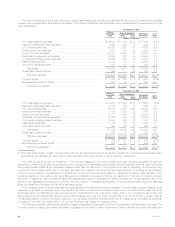
The table below provides a summary of the notional amount and current market or fair value of derivative financial instruments held at:
December 31, 2004 December 31, 2003
Current Market Current Market
or Fair Value or Fair Value
Notional Notional
Amount Assets Liabilities Amount Assets Liabilities
(Dollars in millions)
Interest rate swaps *********************************************** $12,681 $284 $ 22 $ 9,944 $189 $ 36
Interest rate floors ************************************************ 3,325 38 — 325 5 —
Interest rate caps ************************************************ 7,045 12 — 9,345 29 —
Financial futures ************************************************* 611 — 13 1,348 8 30
Foreign currency swaps******************************************* 8,214 150 1,302 4,710 9 796
Foreign currency forwards ***************************************** 1,013 5 57 695 5 32
Options ******************************************************** 825 37 7 6,065 7 —
Financial forwards ************************************************ 326 — — 1,310 2 3
Credit default swaps ********************************************* 1,897 11 5 615 2 1
Synthetic GICs ************************************************** 5,869 — — 5,177 — —
Other ********************************************************** 450 1 1 — — —
Total ********************************************************* $42,256 $538 $1,407 $39,534 $256 $898
MetLife, Inc. 35