MetLife 2004 Annual Report Download - page 94
Download and view the complete annual report
Please find page 94 of the 2004 MetLife annual report below. You can navigate through the pages in the report by either clicking on the pages listed below, or by using the keyword search tool below to find specific information within the annual report.-
 1
1 -
2
-
3
-
4
-
5
-
6
-
7
-
8
-
9
-
10
-
11
-
12
-
13
-
14
-
15
-
16
-
17
-
18
-
19
-
20
-
21
-
22
-
23
-
24
-
25
-
26
-
27
-
28
-
29
-
30
-
31
-
32
-
33
-
34
-
35
-
36
-
37
-
38
-
39
-
40
-
41
-
42
-
43
-
44
-
45
-
46
-
47
-
48
-
49
-
50
-
51
-
52
-
53
-
54
-
55
-
56
-
57
-
58
-
59
-
60
-
61
-
62
-
63
-
64
-
65
-
66
-
67
-
68
-
69
-
70
-
71
-
72
-
73
-
74
-
75
-
76
-
77
-
78
-
79
-
80
-
81
-
82
-
83
-
 84
84 -
 85
85 -
 86
86 -
 87
87 -
 88
88 -
 89
89 -
 90
90 -
 91
91 -
 92
92 -
 93
93 -
 94
94 -
 95
95 -
 96
96 -
 97
97 -
 98
98 -
 99
99 -
 100
100 -
 101
101
 |
 |

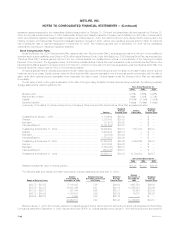
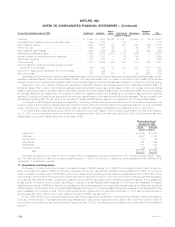
METLIFE, INC.
NOTES TO CONSOLIDATED FINANCIAL STATEMENTS — (Continued)
the accounting for gains (losses) from intercompany sales, which are eliminated in consolidation. The Company allocates capital to each segment based
upon an internal capital allocation system that allows the Company to more effectively manage its capital. The Company evaluates the performance of
each operating segment based upon net income excluding certain net investment gains (losses), net of income taxes, and the impact from the
cumulative effect of changes in accounting, net of income taxes. Scheduled periodic settlement payments on derivative instruments not qualifying for
hedge accounting are included in net investment gains (losses). The Company allocates certain non-recurring items, such as expenses associated with
certain legal proceedings, to Corporate & Other.
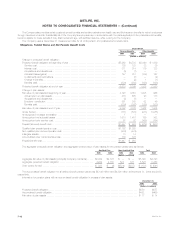
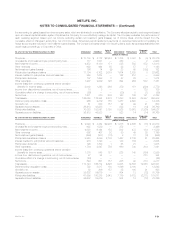
Auto & Corporate
As of or for the Year Ended December 31, 2004 Institutional Individual Home International Reinsurance & Other Total
(Dollars in millions)
Premiums*********************************************** $ 10,103 $ 4,172 $2,948 $ 1,735 $ 3,367 $ (9) $ 22,316
Universal life and investment-type product policy fees ********** 717 1,831 — 350 — 2 2,900
Net investment income************************************ 4,472 6,130 171 585 588 472 12,418
Other revenues ****************************************** 632 444 35 23 57 7 1,198
Net investment gains (losses) ****************************** 186 74 (9) 23 60 (152) 182
Policyholder benefits and claims **************************** 11,134 5,102 2,079 1,614 2,725 8 22,662
Interest credited to policyholder account balances ************* 960 1,674 — 152 212 — 2,998
Policyholder dividends ************************************ 107 1,638 2 47 20 — 1,814
Other expenses****************************************** 1,907 2,939 795 624 964 532 7,761
Income (loss) from continuing operations before provision
(benefit) for income taxes ******************************** 2,002 1,298 269 279 151 (220) 3,779
Income from discontinued operations, net of income taxes****** 10 3 — — — 123 136
Cumulative effect of a change in accounting, net of income taxes (60) — — (30) 5 (1) (86)
Net income ********************************************* 1,271 870 208 163 105 141 2,758
Total assets ********************************************* 126,058 176,384 5,233 11,293 14,503 23,337 356,808
Deferred policy acquisition costs**************************** 965 9,279 185 1,287 2,620 — 14,336
Goodwill, net ******************************************** 61 203 157 92 99 21 633
Separate account assets ********************************** 36,913 48,933 — 923 14 (14) 86,769
Policyholder liabilities************************************** 70,083 103,091 3,180 8,025 10,973 (1,325) 194,027
Separate account liabilities********************************* 36,913 48,933 — 923 14 (14) 86,769
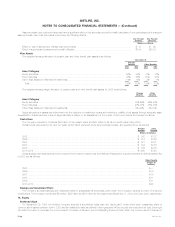
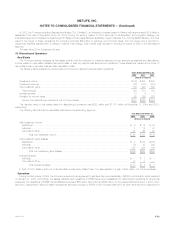
Auto & Corporate
As of or for the Year Ended December 31, 2003 Institutional Individual Home International Reinsurance & Other Total
(Dollars in millions)
Premiums*********************************************** $ 9,093 $ 4,344 $2,908 $ 1,678 $ 2,668 $ (18) $ 20,673
Universal life and investment-type product policy fees ********** 635 1,589 — 272 — — 2,496
Net investment income************************************ 4,028 6,194 158 502 473 184 11,539
Other revenues ****************************************** 592 407 32 80 49 39 1,199
Net investment gains (losses) ****************************** (293) (307) (15) 8 31 (6) (582)
Policyholder benefits and claims **************************** 9,843 5,039 2,139 1,457 2,136 51 20,665
Interest credited to policyholder account balances ************* 915 1,793 — 143 184 — 3,035
Policyholder dividends ************************************ 198 1,700 1 55 21 — 1,975
Other expenses****************************************** 1,784 2,847 756 660 740 304 7,091
Income (loss) from continuing operations before provision
(benefit) for income taxes ******************************** 1,315 848 187 225 140 (156) 2,559
Income from discontinued operations, net of income taxes****** 37 34 — — — 273 344
Cumulative effect of a change in accounting, net of income taxes (26) — — — — — (26)
Net income ********************************************* 849 601 157 208 92 310 2,217
Total assets ********************************************* 113,743 165,774 4,698 9,935 12,833 19,858 326,841
Deferred policy acquisition costs**************************** 739 8,817 180 1,046 2,160 1 12,943
Goodwill, net ******************************************** 59 206 157 85 100 21 628
Separate account assets ********************************** 35,632 39,619 — 504 13 (12) 75,756
Policyholder liabilities************************************** 61,599 100,278 2,943 7,179 9,783 (2,211) 179,571
Separate account liabilities********************************* 35,632 39,619 — 504 13 (12) 75,756
MetLife, Inc. F-51