MetLife 2004 Annual Report Download - page 34
Download and view the complete annual report
Please find page 34 of the 2004 MetLife annual report below. You can navigate through the pages in the report by either clicking on the pages listed below, or by using the keyword search tool below to find specific information within the annual report.-
 1
1 -
2
-
3
-
4
-
5
-
6
-
7
-
8
-
9
-
10
-
11
-
12
-
13
-
14
-
15
-
16
-
17
-
18
-
19
-
20
-
21
-
22
-
23
-
 24
24 -
 25
25 -
 26
26 -
 27
27 -
 28
28 -
 29
29 -
 30
30 -
 31
31 -
 32
32 -
 33
33 -
 34
34 -
 35
35 -
 36
36 -
 37
37 -
 38
38 -
 39
39 -
 40
40 -
 41
41 -
 42
42 -
 43
43 -
 44
44 -
45
-
46
-
47
-
48
-
49
-
50
-
51
-
52
-
53
-
54
-
55
-
56
-
57
-
58
-
59
-
60
-
61
-
62
-
63
-
64
-
65
-
66
-
67
-
68
-
69
-
70
-
71
-
72
-
73
-
74
-
75
-
76
-
77
-
78
-
79
-
80
-
81
-
82
-
83
-
84
-
85
-
86
-
87
-
88
-
89
-
90
-
91
-
92
-
93
-
94
-
95
-
96
-
97
-
98
-
99
-
100
-
101
 |
 |

$102 million, $355 million and $1,375 million for the years ended December 31, 2004, 2003 and 2002, respectively. The Company’s three largest
impairments totaled $53 million, $125 million and $352 million for the years ended December 31, 2004, 2003 and 2002, respectively. The circum-
stances that gave rise to these impairments were either financial restructurings or bankruptcy filings. During the years ended December 31, 2004, 2003
and 2002, the Company sold or disposed of fixed maturities and equity securities at a loss that had a fair value of $29,939 million, $21,984 million and
$10,128 million, respectively. Gross losses excluding impairments for fixed maturities and equity securities were $516 million, $500 million and $979
million for the years ended December 31, 2004, 2003 and 2002, respectively.
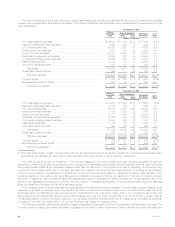
The following table presents the cost or amortized cost, gross unrealized losses and number of securities for fixed maturities and equity securities
where the estimated fair value had declined and remained below cost or amortized cost by less than 20%, or 20% or more for:
December 31, 2004
Cost or Gross Unrealized Number of
Amortized Cost Losses Securities
Less than 20% or Less than 20% or Less than 20% or
20% more 20% more 20% more
(Dollars in millions)
Less than six months********************************************** $27,178 $ 79 $246 $18 3,188 117
Six months or greater but less than nine months*********************** 8,477 9 111 2 687 5
Nine months or greater but less than twelve months******************** 1,595 19 33 4 206 5
Twelve months or greater ****************************************** 2,798 19 80 15 395 7
Total ******************************************************** $40,048 $126 $470 $39 4,476 134
The gross unrealized loss related to the Company’s fixed maturities and equity securities at December 31, 2004 was $509 million. These securities
are concentrated by sector in United States corporates (34%); foreign corporates (17%); and residential mortgage-backed (13%); and are concentrated
by industry in mortgage-backed (20%); finance (10%); and services (10%) (calculated as a percentage of gross unrealized loss). Non-investment grade
securities represent 4% of the $39,665 million fair value and 12% of the $509 million gross unrealized loss.
The Company did not hold any single fixed maturity or equity security with a gross unrealized loss at December 31, 2004 greater than $10 million.
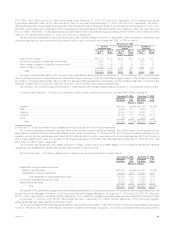
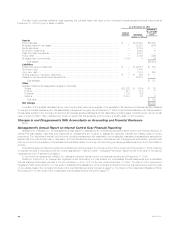
Corporate Fixed Maturities. The table below shows the major industry types that comprise the corporate fixed maturity holdings at:
December 31, 2004 December 31, 2003
Estimated % of Estimated % of
Fair Value Total Fair Value Total
(Dollars in millions)
Industrial *************************************************************************** $35,785 39.9% $34,474 40.9%
Utility ****************************************************************************** 10,800 12.1 9,955 11.8
Finance**************************************************************************** 14,481 16.2 14,287 17.0
Foreign(1) ************************************************************************** 27,838 31.1 23,842 28.3
Other ***************************************************************************** 654 0.7 1,675 2.0
Total ************************************************************************** $89,558 100.0% $84,233 100.0%
(1) Includes U.S. dollar-denominated debt obligations of foreign obligors, and other foreign investments.
The Company maintains a diversified corporate fixed maturity portfolio across industries and issuers. The portfolio does not have exposure to any
single issuer in excess of 1% of the total invested assets of the portfolio. At December 31, 2004 and 2003, the Company’s combined holdings in the ten
issuers to which it had the greatest exposure totaled $4,967 million and $4,683 million, respectively, both of which was less than 3% of the Company’s
total invested assets at such date. The exposure to the largest single issuer of corporate fixed maturities held at December 31, 2004 and 2003 was
$631 million and $618 million, respectively.
The Company has hedged all of its material exposure to foreign currency risk in its invested assets. In the Company’s international insurance
operations, both its assets and liabilities are generally denominated in local currencies.
Structured Securities. The following table shows the types of structured securities the Company held at:
December 31, 2004 December 31, 2003
Estimated % of Estimated % of
Fair Value Total Fair Value Total
(Dollars in millions)
Residential mortgage-backed securities:
Pass-through securities ************************************************************ $12,478 22.4% $15,427 28.4%
Collateralized mortgage obligations *************************************************** 19,752 35.5 16,027 29.5
Total residential mortgage-backed securities ************************************* 32,230 57.9 31,454 57.9
Commercial mortgage-backed securities ************************************************ 12,501 22.5 11,031 20.3
Asset-backed securities ************************************************************** 10,876 19.6 11,863 21.8
Total ********************************************************************** $55,607 100.0% $54,348 100.0%
The majority of the residential mortgage-backed securities are guaranteed or otherwise supported by the Federal National Mortgage Association, the
Federal Home Loan Mortgage Corporation or the Government National Mortgage Association. At December 31, 2004 and 2003, $31,768 million and
$31,210 million, respectively, or 98.6% and 99.2%, respectively, of the residential mortgage-backed securities were rated Aaa/AAA by Moody’s or S&P.
At December 31, 2004 and 2003, $8,750 million and $6,992 million, respectively, or 70.0% and 63.4%, respectively, of the commercial mortgage-
backed securities were rated Aaa/AAA by Moody’s or S&P.
The Company’s asset-backed securities are diversified both by sector and by issuer. Credit card and home equity loan securitizations, accounting
for about 26% and 32% of the total holdings, respectively, constitute the largest exposures in the Company’s asset-backed securities portfolio.
MetLife, Inc. 31