Lenovo 2013 Annual Report Download - page 81
Download and view the complete annual report
Please find page 81 of the 2013 Lenovo annual report below. You can navigate through the pages in the report by either clicking on the pages listed below, or by using the keyword search tool below to find specific information within the annual report.-
 1
1 -
2
-
3
-
4
-
5
-
6
-
7
-
8
-
9
-
10
-
11
-
12
-
13
-
14
-
15
-
16
-
17
-
18
-
19
-
20
-
21
-
22
-
23
-
24
-
25
-
26
-
27
-
28
-
29
-
30
-
31
-
32
-
33
-
34
-
35
-
36
-
37
-
38
-
39
-
40
-
41
-
42
-
43
-
44
-
45
-
46
-
47
-
48
-
49
-
50
-
51
-
52
-
53
-
54
-
55
-
56
-
57
-
58
-
59
-
60
-
61
-
62
-
63
-
64
-
65
-
66
-
67
-
68
-
69
-
70
-
 71
71 -
 72
72 -
 73
73 -
 74
74 -
 75
75 -
 76
76 -
 77
77 -
 78
78 -
 79
79 -
 80
80 -
 81
81 -
 82
82 -
 83
83 -
 84
84 -
 85
85 -
 86
86 -
 87
87 -
 88
88 -
 89
89 -
 90
90 -
 91
91 -
92
-
93
-
94
-
95
-
96
-
97
-
98
-
99
-
100
-
101
-
102
-
103
-
104
-
105
-
106
-
107
-
108
-
109
-
110
-
111
-
112
-
113
-
114
-
115
-
116
-
117
-
118
-
119
-
120
-
121
-
122
-
123
-
124
-
125
-
126
-
127
-
128
-
129
-
130
-
131
-
132
-
133
-
134
-
135
-
136
-
137
-
138
-
139
-
140
-
141
-
142
-
143
-
144
-
145
-
146
-
147
-
148
-
149
-
150
-
151
-
152
-
153
-
154
-
155
-
156
-
157
-
158
-
159
-
160
-
161
-
162
-
163
-
164
-
165
-
166
-
167
-
168
-
169
-
170
-
171
-
172
-
173
-
174
-
175
-
176
-
177
-
178
-
179
-
180
-
181
-
182
-
183
-
184
-
185
-
186
-
187
-
188
 |
 |

2012/13 Annual Report Lenovo Group Limited 79
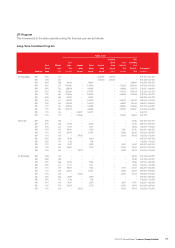
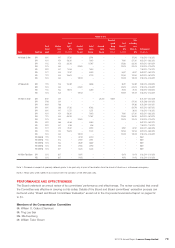
Number of units
Name Award type
Fiscal
Year of
Award
Effective
price
(HK$)
As at
April 1,
2012
(Unvested)
Awarded
during
the year
Vested
during
the year
Exercised
during
the year
Cancelled/
lapsed
during
the year
(Note 2)
As at
March 31,
2013
(unvested)
Total
outstanding
as at
March 31,
2013
Vesting period
(mm.dd.yyyy)
Mr. Nicholas C. Allen SAR 09/10 4.47 35,781 – 35,781 – – – 107,343 11.30.2010 – 11.30.2012
SAR 10/11 4.59 158,001 – 79,000 – – 79,001 237,001 08.20.2011 – 08.20.2013
SAR 11/12 4.56 323,000 – 107,667 – – 215,333 323,000 08.19.2012 – 08.19.2014
SAR 12/13 6.36 – 274,316 – – – 274,316 274,316 07.03.2013 – 07.03.2015
RSU 09/10 4.47 16,264 – 16,264 – – – – 11.30.2010 – 11.30.2012
RSU 10/11 4.59 79,001 – 39,500 – – 39,501 39,501 08.20.2011 – 08.20.2013
RSU 11/12 4.56 153,810 – 51,270 – – 102,540 102,540 08.19.2012 – 08.19.2014
RSU 12/13 6.36 – 109,729 – – – 109,729 109,729 07.03.2013 – 07.03.2015
Mr. Nobuyuki Idei SAR 11/12 5.23 144,085 – 48,028 – – 96,057 144,085 09.28.2012 – 09.28.2014
SAR 12/13 6.36 – 274,316 – – – 274,316 274,316 07.03.2013 – 07.03.2015
RSU 11/12 5.23 68,612 – 22,870 – – 45,742 45,742 09.28.2012 – 09.28.2014
RSU 12/13 6.36 – 109,729 – – – 109,729 109,729 07.03.2013 – 07.03.2015
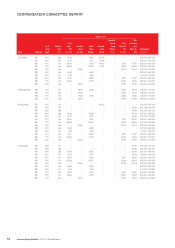
Mr. William O. Grabe SAR 06/07 2.99 – – – 390,000 169,615 – – 06.01.2007 – 06.01.2009
SAR 07/08 3.94 – – – – – – 297,000 06.01.2008 – 06.01.2010
SAR 08/09 5.88 – – – – – – 195,980 06.01.2009 – 06.01.2011
SAR 09/10 3.88 87,932 – 87,932 – – – 263,796 08.07.2010 – 08.07.2012
SAR 09/10 4.47 12,721 – 12,721 – – – 38,163 11.30.2010 – 11.30.2012
SAR 10/11 4.59 158,001 – 79,000 – – 79,001 237,001 08.20.2011 – 08.20.2013
SAR 11/12 4.56 323,000 – 107,667 – – 215,333 323,000 08.19.2012 – 08.19.2014
SAR 12/13 6.36 – 274,316 – – – 274,316 274,316 07.03.2013 – 07.03.2015
RSU 09/10 3.88 39,969 – 39,969 – – – – 08.07.2010 – 08.07.2012
RSU 09/10 4.47 5,783 – 5,783 – – – – 11.30.2010 – 11.30.2012
RSU 10/11 4.59 79,001 – 39,500 – – 39,501 39,501 08.20.2011 – 08.20.2013
RSU 11/12 4.56 153,810 – 51,270 – – 102,540 102,540 08.19.2012 – 08.20.2014
RSU 12/13 6.36 – 109,729 – – – 109,729 109,729 07.03.2013 – 07.03.2015
RSU (Deferral) 11/12 5.78 – 30,169 30,169 – – – – Note 1
RSU (Deferral) 11/12 6.73 – 25,961 25,961 – – – – Note 1
RSU (Deferral) 12/13 6.23 – 28,387 28,387 – – – – Note 1
RSU (Deferral) 12/13 6.96 – 25,940 25,940 – – – – Note 1
RSU (Deferral) 12/13 8.07 – 22,372 22,372 – – – – Note 1
Mr. William Tudor Brown SAR 12/13 8.07 – 53,476 – – – 53,476 53,476 01.31.2014 – 01.31.2016
RSU 12/13 8.07 – 14,453 – – – 14,453 14,453 01.31.2014 – 01.31.2016
Note 1: Proceeds in respect of quarterly deferral grants to be paid only at point of termination from the board of directors or unforeseen emergency.
Note 2: These units were nullified in accordance with the operation of the SAR plan rules.
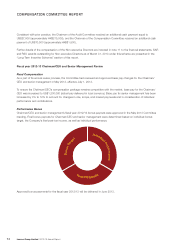
PERFORMANCE AND EFFECTIVENESS
The Board undertook an annual review of its committees’ performance and effectiveness. The review concluded that overall
the Committee was effective in carrying out its duties. Details of the Board and Board committees’ evaluation process can
be found under “Board and Board Committees’ Evaluation” as set out in the Corporate Governance Report on pages 52
to 53.
Members of the Compensation Committee
Mr. William O. Grabe (Chairman)
Mr. Ting Lee Sen
Ms. Ma Xuezheng
Mr. William Tudor Brown