Lenovo 2013 Annual Report Download - page 164
Download and view the complete annual report
Please find page 164 of the 2013 Lenovo annual report below. You can navigate through the pages in the report by either clicking on the pages listed below, or by using the keyword search tool below to find specific information within the annual report.-
 1
1 -
2
-
3
-
4
-
5
-
6
-
7
-
8
-
9
-
10
-
11
-
12
-
13
-
14
-
15
-
16
-
17
-
18
-
19
-
20
-
21
-
22
-
23
-
24
-
25
-
26
-
27
-
28
-
29
-
30
-
31
-
32
-
33
-
34
-
35
-
36
-
37
-
38
-
39
-
40
-
41
-
42
-
43
-
44
-
45
-
46
-
47
-
48
-
49
-
50
-
51
-
52
-
53
-
54
-
55
-
56
-
57
-
58
-
59
-
60
-
61
-
62
-
63
-
64
-
65
-
66
-
67
-
68
-
69
-
70
-
71
-
72
-
73
-
74
-
75
-
76
-
77
-
78
-
79
-
80
-
81
-
82
-
83
-
84
-
85
-
86
-
87
-
88
-
89
-
90
-
91
-
92
-
93
-
94
-
95
-
96
-
97
-
98
-
99
-
100
-
101
-
102
-
103
-
104
-
105
-
106
-
107
-
108
-
109
-
110
-
111
-
112
-
113
-
114
-
115
-
116
-
117
-
118
-
119
-
120
-
121
-
122
-
123
-
124
-
125
-
126
-
127
-
128
-
129
-
130
-
131
-
132
-
133
-
134
-
135
-
136
-
137
-
138
-
139
-
140
-
141
-
142
-
143
-
144
-
145
-
146
-
147
-
148
-
149
-
150
-
151
-
152
-
153
-
 154
154 -
 155
155 -
 156
156 -
 157
157 -
 158
158 -
 159
159 -
 160
160 -
 161
161 -
 162
162 -
 163
163 -
 164
164 -
 165
165 -
 166
166 -
 167
167 -
 168
168 -
 169
169 -
 170
170 -
 171
171 -
 172
172 -
 173
173 -
 174
174 -
175
-
176
-
177
-
178
-
179
-
180
-
181
-
182
-
183
-
184
-
185
-
186
-
187
-
188
 |
 |

NOTES TO THE FINANCIAL STATEMENTS
Lenovo Group Limited 2012/13 Annual Report
162
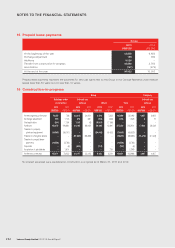
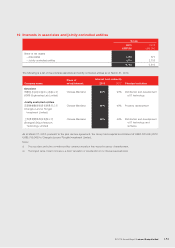
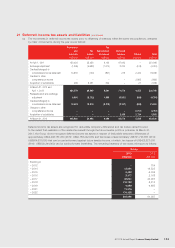
21 Deferred income tax assets and liabilities (continued)
(b) The movements in deferred income tax liabilities (prior to offsetting of balances within the same tax jurisdiction),
analyzed by major components, during the year are as follows:
Intangible
valuation
Undistributed
earnings
Property
valuation
Accelerated
tax
depreciation Others Total
US$’000 US$’000 US$’000 US$’000 US$000 US$’000
At April 1, 2011 – 16,610 – 483 – 17,093
Exchange adjustment – (23) – 15 – (8)
(Credited)/charged to
consolidated income statement (1,219) 10,681 (483) (271) – 8,708
Acquisition of subsidiaries 53,190 – 4,884 – – 58,074
At March 31, 2012 and
April 1, 2013 51,971 27,268 4,401 227 – 83,867
Reclassification and exchange
adjustment (5,254) (442) (525) (650) 4,828 (2,043)
(Credited)/charged to
consolidated income statement (2,535) 9,760 397 1,171 – 8,793
Credited to other
comprehensive income – – – – (99) (99)
Acquisition of subsidiaries 27,911 – – – – 27,911
At March 31, 2013 72,093 36,586 4,273 748 4,729 118,429
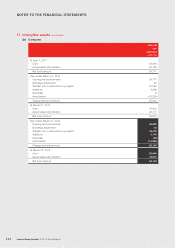
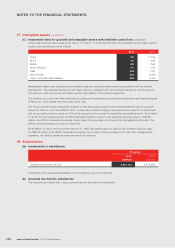
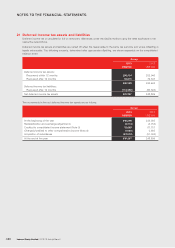
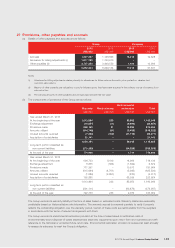
22 Available-for-sale financial assets
Group
2013 2012
US$’000 US$’000
At the beginning of the year 71,946 78,689
Exchange adjustment (1,072) (120)
Fair value change recognized in other comprehensive income (4,057) (36,337)
Additions 4,104 10,055
Disposals (959) –
Acquisition of subsidiaries –19,659
At the end of the year 69,962 71,946
Equity securities, at fair value
Listed in Hong Kong 498 512
Listed outside Hong Kong 53,302 59,113
Unlisted 16,162 12,321
69,962 71,946
23 Inventories
Group
2013 2012
US$’000 US$’000
Raw materials and work-in-progress 884,591 484,314
Finished goods 910,666 613,962
Service parts 169,534 120,218
1,964,791 1,218,494