Lenovo 2013 Annual Report Download - page 186
Download and view the complete annual report
Please find page 186 of the 2013 Lenovo annual report below. You can navigate through the pages in the report by either clicking on the pages listed below, or by using the keyword search tool below to find specific information within the annual report.-
 1
1 -
2
-
3
-
4
-
5
-
6
-
7
-
8
-
9
-
10
-
11
-
12
-
13
-
14
-
15
-
16
-
17
-
18
-
19
-
20
-
21
-
22
-
23
-
24
-
25
-
26
-
27
-
28
-
29
-
30
-
31
-
32
-
33
-
34
-
35
-
36
-
37
-
38
-
39
-
40
-
41
-
42
-
43
-
44
-
45
-
46
-
47
-
48
-
49
-
50
-
51
-
52
-
53
-
54
-
55
-
56
-
57
-
58
-
59
-
60
-
61
-
62
-
63
-
64
-
65
-
66
-
67
-
68
-
69
-
70
-
71
-
72
-
73
-
74
-
75
-
76
-
77
-
78
-
79
-
80
-
81
-
82
-
83
-
84
-
85
-
86
-
87
-
88
-
89
-
90
-
91
-
92
-
93
-
94
-
95
-
96
-
97
-
98
-
99
-
100
-
101
-
102
-
103
-
104
-
105
-
106
-
107
-
108
-
109
-
110
-
111
-
112
-
113
-
114
-
115
-
116
-
117
-
118
-
119
-
120
-
121
-
122
-
123
-
124
-
125
-
126
-
127
-
128
-
129
-
130
-
131
-
132
-
133
-
134
-
135
-
136
-
137
-
138
-
139
-
140
-
141
-
142
-
143
-
144
-
145
-
146
-
147
-
148
-
149
-
150
-
151
-
152
-
153
-
154
-
155
-
156
-
157
-
158
-
159
-
160
-
161
-
162
-
163
-
164
-
165
-
166
-
167
-
168
-
169
-
170
-
171
-
172
-
173
-
174
-
175
-
 176
176 -
 177
177 -
 178
178 -
 179
179 -
 180
180 -
 181
181 -
 182
182 -
 183
183 -
 184
184 -
 185
185 -
 186
186 -
 187
187 -
 188
188
 |
 |
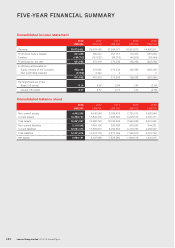
FIVE-YEAR FINANCIAL SUMMARY
Lenovo Group Limited 2012/13 Annual Report
184
Consolidated income statement
2013 2012 2011 2010 2009
US$’000 US$’000 US$’000 US$’000 US$’000
Revenue 33,873,401 29,574,438 21,594,371 16,604,815 14,900,931
Profit/(loss) before taxation 801,299 582,443 357,751 176,303 (187,945)
Taxation (169,707) (107,027) (84,515) (46,935) (38,444)
Profit/(loss) for the year 631,592 475,416 273,236 129,368 (226,389)
Profit/(loss) attributable to:
Equity holders of the Company 635,148 472,992 273,234 129,368 (226,392)
Non-controlling interests (3,556) 2,424 2 – 3
631,592 475,416 273,236 129,368 (226,389)
Earnings/(loss) per share
Basic (US cents) 6.16 4.67 2.84 1.42 (2.56)
Diluted (US cents) 6.07 4.57 2.73 1.33 (2.56)
Consolidated balance sheet
2013 2012 2011 2010 2009
US$’000 US$’000 US$’000 US$’000 US$’000
Non-current assets 4,492,260 4,040,348 2,769,476 2,720,315 2,520,946
Current assets 12,389,737 11,820,400 7,936,463 6,235,613 4,100,717
Total assets 16,881,997 15,860,748 10,705,939 8,955,928 6,621,663
Non-current liabilities 2,110,342 1,603,102 838,386 930,557 844,221
Current liabilities 12,091,474 11,809,677 8,032,653 6,419,353 4,466,527
Total liabilities 14,201,816 13,412,779 8,871,039 7,349,910 5,310,748
Net assets 2,680,181 2,447,969 1,834,900 1,606,018 1,310,915