Lenovo 2013 Annual Report Download - page 29
Download and view the complete annual report
Please find page 29 of the 2013 Lenovo annual report below. You can navigate through the pages in the report by either clicking on the pages listed below, or by using the keyword search tool below to find specific information within the annual report.-
 1
1 -
2
-
3
-
4
-
5
-
6
-
7
-
8
-
9
-
10
-
11
-
12
-
13
-
14
-
15
-
16
-
17
-
18
-
 19
19 -
 20
20 -
 21
21 -
 22
22 -
 23
23 -
 24
24 -
 25
25 -
 26
26 -
 27
27 -
 28
28 -
 29
29 -
 30
30 -
 31
31 -
 32
32 -
 33
33 -
 34
34 -
 35
35 -
 36
36 -
 37
37 -
 38
38 -
 39
39 -
40
-
41
-
42
-
43
-
44
-
45
-
46
-
47
-
48
-
49
-
50
-
51
-
52
-
53
-
54
-
55
-
56
-
57
-
58
-
59
-
60
-
61
-
62
-
63
-
64
-
65
-
66
-
67
-
68
-
69
-
70
-
71
-
72
-
73
-
74
-
75
-
76
-
77
-
78
-
79
-
80
-
81
-
82
-
83
-
84
-
85
-
86
-
87
-
88
-
89
-
90
-
91
-
92
-
93
-
94
-
95
-
96
-
97
-
98
-
99
-
100
-
101
-
102
-
103
-
104
-
105
-
106
-
107
-
108
-
109
-
110
-
111
-
112
-
113
-
114
-
115
-
116
-
117
-
118
-
119
-
120
-
121
-
122
-
123
-
124
-
125
-
126
-
127
-
128
-
129
-
130
-
131
-
132
-
133
-
134
-
135
-
136
-
137
-
138
-
139
-
140
-
141
-
142
-
143
-
144
-
145
-
146
-
147
-
148
-
149
-
150
-
151
-
152
-
153
-
154
-
155
-
156
-
157
-
158
-
159
-
160
-
161
-
162
-
163
-
164
-
165
-
166
-
167
-
168
-
169
-
170
-
171
-
172
-
173
-
174
-
175
-
176
-
177
-
178
-
179
-
180
-
181
-
182
-
183
-
184
-
185
-
186
-
187
-
188
 |
 |

2012/13 Annual Report Lenovo Group Limited 27
PIO
NE
ER
PIO
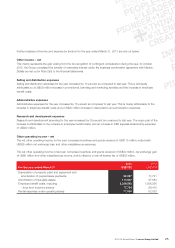
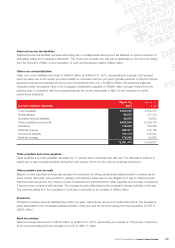
Deferred income tax assets
Deferred income tax assets as at March 31, 2013 amounted to US$349 million, representing an increase of 5 percent
over last year, which is mainly attributable to temporary differences in relation to provisions, accruals and deferred revenue
arising in the normal course of business.
Current assets (US$’000)
March 31,
2013
March 31,
2012
Inventories 1,964,791 1,218,494
Trade receivables 2,885,039 2,354,909
Notes receivable 572,992 639,331
Derivative financial assets 99,491 62,883
Deposits, prepayments and other receivables 3,235,465 3,303,053
Income tax recoverable 58,822 70,406
Bank deposits 119,055 413,672
Cash and cash equivalents 3,454,082 3,757,652
12,389,737 11,820,400
Inventories
Inventories increased by 61 percent, which is in line with business growth, changes in product mix resulted from expanded
consumer sales and higher demand of mobile internet and digital home products. During the year, the Group has shifted
further to in-house manufacturing which resulted to the increase in raw materials and service parts. The completion of the
business combination activities during the year also contributed to an increase of inventories by US$158 million.
Trade receivables and Notes receivable
Trade receivables and notes receivable increased in line with the increase in activities during the year. The new customers
arising from the formation of EMC JV and the acquisition of CCE and Stoneware increased the trade receivables of the
Group by US$118 million.
Derivative financial assets/liabilities
Derivatives relate to foreign currency forward contracts that are designated as hedges for the fair value of recognized
assets or liabilities or a firm commitment, or of highly probable forecast transactions. Derivatives are initially recognized at
fair value on the date of a derivative contract is entered into and are subsequently re-measured at their fair values. Increase
in balance is in line with increased business activities during the year.