Lenovo 2013 Annual Report Download - page 174
Download and view the complete annual report
Please find page 174 of the 2013 Lenovo annual report below. You can navigate through the pages in the report by either clicking on the pages listed below, or by using the keyword search tool below to find specific information within the annual report.-
 1
1 -
2
-
3
-
4
-
5
-
6
-
7
-
8
-
9
-
10
-
11
-
12
-
13
-
14
-
15
-
16
-
17
-
18
-
19
-
20
-
21
-
22
-
23
-
24
-
25
-
26
-
27
-
28
-
29
-
30
-
31
-
32
-
33
-
34
-
35
-
36
-
37
-
38
-
39
-
40
-
41
-
42
-
43
-
44
-
45
-
46
-
47
-
48
-
49
-
50
-
51
-
52
-
53
-
54
-
55
-
56
-
57
-
58
-
59
-
60
-
61
-
62
-
63
-
64
-
65
-
66
-
67
-
68
-
69
-
70
-
71
-
72
-
73
-
74
-
75
-
76
-
77
-
78
-
79
-
80
-
81
-
82
-
83
-
84
-
85
-
86
-
87
-
88
-
89
-
90
-
91
-
92
-
93
-
94
-
95
-
96
-
97
-
98
-
99
-
100
-
101
-
102
-
103
-
104
-
105
-
106
-
107
-
108
-
109
-
110
-
111
-
112
-
113
-
114
-
115
-
116
-
117
-
118
-
119
-
120
-
121
-
122
-
123
-
124
-
125
-
126
-
127
-
128
-
129
-
130
-
131
-
132
-
133
-
134
-
135
-
136
-
137
-
138
-
139
-
140
-
141
-
142
-
143
-
144
-
145
-
146
-
147
-
148
-
149
-
150
-
151
-
152
-
153
-
154
-
155
-
156
-
157
-
158
-
159
-
160
-
161
-
162
-
163
-
 164
164 -
 165
165 -
 166
166 -
 167
167 -
 168
168 -
 169
169 -
 170
170 -
 171
171 -
 172
172 -
 173
173 -
 174
174 -
 175
175 -
 176
176 -
 177
177 -
 178
178 -
 179
179 -
 180
180 -
 181
181 -
 182
182 -
 183
183 -
 184
184 -
185
-
186
-
187
-
188
 |
 |

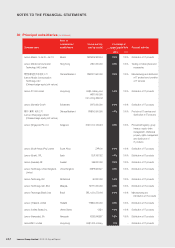
NOTES TO THE FINANCIAL STATEMENTS
Lenovo Group Limited 2012/13 Annual Report
172
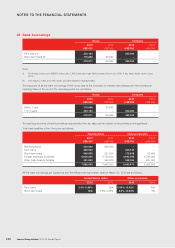
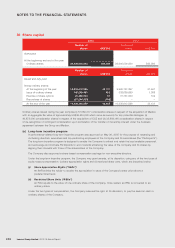
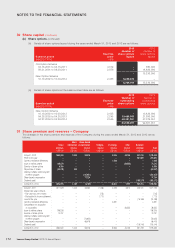
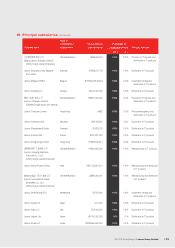
30 Share capital (continued)
(b) Share options (continued)
(iii) Details of share options lapsed during the years ended March 31, 2013 and 2012 are as follows:
2013 2012
Exercise period
Exercise
price
Number of
share options
lapsed
Number of
share options
lapsed
(MM.DD.YYYY) HK$
Old Option Scheme
04.16.2001 to 04.15.2011 4.072 –380,000
08.31.2001 to 08.30.2011 2.876 –14,836,000
–15,216,000
New Option Scheme
10.10.2002 to 10.09.2012 2.435 8,236,000 –
8,236,000 15,216,000
(iv) Details of share options at the balance sheet date are as follows:
2013 2012
Exercise period
Exercise
price
Number of
outstanding
share options
Number of
outstanding
share options
(MM.DD.YYYY) HK$
New Option Scheme
10.10.2002 to 10.09.2012 2.435 –13,426,000
04.26.2003 to 04.25.2013 2.245 15,488,000 21,856,000
04.27.2004 to 04.26.2014 2.545 48,451,051 57,379,051
63,939,051 92,661,051
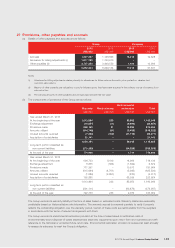
31 Share premium and reserves – Company
The changes in the share premium and reserves of the Company during the years ended March 31, 2013 and 2012 are as
follows:
Share
premium
Share
redemption
reserve
Share-based
compensation
reserve
Hedging
reserve
Exchange
reserve
Other
reserve
Retained
earnings Total
US$’000 US$’000 US$’000 US$’000 US$’000 US$’000 US$’000 US$’000
At April 1, 2012 1,584,522 1,003 53,078 – 8,956 40,125 231,799 1,919,483
Profit for the year – – – – – – 251,582 251,582
Currency translation differences – – – – 1,248 – – 1,248
Issue of ordinary shares 108,070 – – – – (36,555) – 71,515
Exercise of share options 6,336 – – – – – – 6,336
Repurchase of shares (44,122) 185 – – – – – (43,937)
Vesting of shares under long-term
incentive program – – (133,951) – – – – (133,951)
Share-based compensation – – 77,724 – – – – 77,724
Dividends paid – – – – – – (193,177) (193,177)
At March 31, 2013 1,654,806 1,188 (3,149) – 10,204 3,570 290,204 1,956,823
At April 1, 2011 1,377,529 1,003 63,280 (1,033) 4,259 3,570 423,131 1,871,739
Interest rate swap contracts
– Fair value loss, net of taxes – – – (745) – – – (745)
– Reclassified to income statement – – – 1,778 – – – 1,778
Loss for the year – – – – – – (75,188) (75,188)
Currency translation differences – – – – 4,697 – – 4,697
Consideration for acquisition
of a subsidiary – – – – – 36,555 – 36,555
Issue of ordinary shares 196,206 – – – – – – 196,206
Exercise of share options 10,787 – – – – – – 10,787
Vesting of shares under long-term
incentive program – – (76,620) – – – – (76,620)
Share-based compensation – – 66,418 – – – – 66,418
Dividends paid – – – – – – (116,144) (116,144)
At March 31, 2012 1,584,522 1,003 53,078 – 8,956 40,125 231,799 1,919,483