Lenovo 2013 Annual Report Download - page 114
Download and view the complete annual report
Please find page 114 of the 2013 Lenovo annual report below. You can navigate through the pages in the report by either clicking on the pages listed below, or by using the keyword search tool below to find specific information within the annual report.-
 1
1 -
2
-
3
-
4
-
5
-
6
-
7
-
8
-
9
-
10
-
11
-
12
-
13
-
14
-
15
-
16
-
17
-
18
-
19
-
20
-
21
-
22
-
23
-
24
-
25
-
26
-
27
-
28
-
29
-
30
-
31
-
32
-
33
-
34
-
35
-
36
-
37
-
38
-
39
-
40
-
41
-
42
-
43
-
44
-
45
-
46
-
47
-
48
-
49
-
50
-
51
-
52
-
53
-
54
-
55
-
56
-
57
-
58
-
59
-
60
-
61
-
62
-
63
-
64
-
65
-
66
-
67
-
68
-
69
-
70
-
71
-
72
-
73
-
74
-
75
-
76
-
77
-
78
-
79
-
80
-
81
-
82
-
83
-
84
-
85
-
86
-
87
-
88
-
89
-
90
-
91
-
92
-
93
-
94
-
95
-
96
-
97
-
98
-
99
-
100
-
101
-
102
-
103
-
 104
104 -
 105
105 -
 106
106 -
 107
107 -
 108
108 -
 109
109 -
 110
110 -
 111
111 -
 112
112 -
 113
113 -
 114
114 -
 115
115 -
 116
116 -
 117
117 -
 118
118 -
 119
119 -
 120
120 -
 121
121 -
 122
122 -
 123
123 -
 124
124 -
125
-
126
-
127
-
128
-
129
-
130
-
131
-
132
-
133
-
134
-
135
-
136
-
137
-
138
-
139
-
140
-
141
-
142
-
143
-
144
-
145
-
146
-
147
-
148
-
149
-
150
-
151
-
152
-
153
-
154
-
155
-
156
-
157
-
158
-
159
-
160
-
161
-
162
-
163
-
164
-
165
-
166
-
167
-
168
-
169
-
170
-
171
-
172
-
173
-
174
-
175
-
176
-
177
-
178
-
179
-
180
-
181
-
182
-
183
-
184
-
185
-
186
-
187
-
188
 |
 |
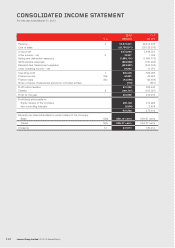
CONSOLIDATED INCOME STATEMENT
For the year ended March 31, 2013
Lenovo Group Limited 2012/13 Annual Report
112
2013 2012
Note US$’000 US$’000
Revenue 533,873,401 29,574,438
Cost of sales (29,799,511) (26,128,216)
Gross profit 4,073,890 3,446,222
Other income – net 6 19,907 1,199
Selling and distribution expenses (1,888,101) (1,690,778)
Administrative expenses (846,688) (730,294)
Research and development expenses (623,987) (453,334)
Other operating income – net 64,984 11,070
Operating profit 7 800,005 584,085
Finance income 8(a) 44,881 42,693
Finance costs 8(b) (42,869) (43,484)
Share of losses of associates and jointly controlled entities (718) (851)
Profit before taxation 801,299 582,443
Taxation 9(169,707) (107,027)
Profit for the year 631,592 475,416
Profit/(loss) attributable to:
Equity holders of the Company 635,148 472,992
Non-controlling interests (3,556) 2,424
631,592 475,416
Earnings per share attributable to equity holders of the Company
Basic 12(a) US6.16 cents US4.67 cents
Diluted 12(b) US6.07 cents US4.57 cents
Dividends 13 247,674 183,214