Lenovo 2013 Annual Report Download - page 115
Download and view the complete annual report
Please find page 115 of the 2013 Lenovo annual report below. You can navigate through the pages in the report by either clicking on the pages listed below, or by using the keyword search tool below to find specific information within the annual report.-
 1
1 -
2
-
3
-
4
-
5
-
6
-
7
-
8
-
9
-
10
-
11
-
12
-
13
-
14
-
15
-
16
-
17
-
18
-
19
-
20
-
21
-
22
-
23
-
24
-
25
-
26
-
27
-
28
-
29
-
30
-
31
-
32
-
33
-
34
-
35
-
36
-
37
-
38
-
39
-
40
-
41
-
42
-
43
-
44
-
45
-
46
-
47
-
48
-
49
-
50
-
51
-
52
-
53
-
54
-
55
-
56
-
57
-
58
-
59
-
60
-
61
-
62
-
63
-
64
-
65
-
66
-
67
-
68
-
69
-
70
-
71
-
72
-
73
-
74
-
75
-
76
-
77
-
78
-
79
-
80
-
81
-
82
-
83
-
84
-
85
-
86
-
87
-
88
-
89
-
90
-
91
-
92
-
93
-
94
-
95
-
96
-
97
-
98
-
99
-
100
-
101
-
102
-
103
-
104
-
 105
105 -
 106
106 -
 107
107 -
 108
108 -
 109
109 -
 110
110 -
 111
111 -
 112
112 -
 113
113 -
 114
114 -
 115
115 -
 116
116 -
 117
117 -
 118
118 -
 119
119 -
 120
120 -
 121
121 -
 122
122 -
 123
123 -
 124
124 -
 125
125 -
126
-
127
-
128
-
129
-
130
-
131
-
132
-
133
-
134
-
135
-
136
-
137
-
138
-
139
-
140
-
141
-
142
-
143
-
144
-
145
-
146
-
147
-
148
-
149
-
150
-
151
-
152
-
153
-
154
-
155
-
156
-
157
-
158
-
159
-
160
-
161
-
162
-
163
-
164
-
165
-
166
-
167
-
168
-
169
-
170
-
171
-
172
-
173
-
174
-
175
-
176
-
177
-
178
-
179
-
180
-
181
-
182
-
183
-
184
-
185
-
186
-
187
-
188
 |
 |

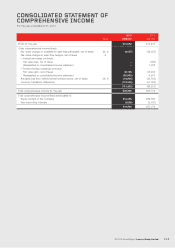
CONSOLIDATED STATEMENT OF
COMPREHENSIVE INCOME
For the year ended March 31, 2013
2012/13 Annual Report Lenovo Group Limited 113
2013 2012
Note US$’000 US$’000
Profit for the year 631,592 475,416
Other comprehensive income/(loss):
Fair value change on available-for-sale financial assets, net of taxes 22, 9 (4,057) (36,337)
Fair value change on cash flow hedges, net of taxes 9
– Interest rate swap contracts
Fair value loss, net of taxes –(763)
Reclassified to consolidated income statement –1,778
– Forward foreign exchange contracts
Fair value gain, net of taxes 40,725 23,233
Reclassified to consolidated income statement (20,953) 9,610
Actuarial loss from defined benefit pension plans, net of taxes 36, 9 (18,806) (34,703)
Currency translation differences (118,602) (51,055)
(121,693) (88,237)
Total comprehensive income for the year 509,899 387,179
Total comprehensive income/(loss) attributable to:
Equity holders of the Company 513,455 389,366
Non-controlling interests (3,556) (2,187)
509,899 387,179