Lenovo 2013 Annual Report Download - page 163
Download and view the complete annual report
Please find page 163 of the 2013 Lenovo annual report below. You can navigate through the pages in the report by either clicking on the pages listed below, or by using the keyword search tool below to find specific information within the annual report.-
 1
1 -
2
-
3
-
4
-
5
-
6
-
7
-
8
-
9
-
10
-
11
-
12
-
13
-
14
-
15
-
16
-
17
-
18
-
19
-
20
-
21
-
22
-
23
-
24
-
25
-
26
-
27
-
28
-
29
-
30
-
31
-
32
-
33
-
34
-
35
-
36
-
37
-
38
-
39
-
40
-
41
-
42
-
43
-
44
-
45
-
46
-
47
-
48
-
49
-
50
-
51
-
52
-
53
-
54
-
55
-
56
-
57
-
58
-
59
-
60
-
61
-
62
-
63
-
64
-
65
-
66
-
67
-
68
-
69
-
70
-
71
-
72
-
73
-
74
-
75
-
76
-
77
-
78
-
79
-
80
-
81
-
82
-
83
-
84
-
85
-
86
-
87
-
88
-
89
-
90
-
91
-
92
-
93
-
94
-
95
-
96
-
97
-
98
-
99
-
100
-
101
-
102
-
103
-
104
-
105
-
106
-
107
-
108
-
109
-
110
-
111
-
112
-
113
-
114
-
115
-
116
-
117
-
118
-
119
-
120
-
121
-
122
-
123
-
124
-
125
-
126
-
127
-
128
-
129
-
130
-
131
-
132
-
133
-
134
-
135
-
136
-
137
-
138
-
139
-
140
-
141
-
142
-
143
-
144
-
145
-
146
-
147
-
148
-
149
-
150
-
151
-
152
-
 153
153 -
 154
154 -
 155
155 -
 156
156 -
 157
157 -
 158
158 -
 159
159 -
 160
160 -
 161
161 -
 162
162 -
 163
163 -
 164
164 -
 165
165 -
 166
166 -
 167
167 -
 168
168 -
 169
169 -
 170
170 -
 171
171 -
 172
172 -
 173
173 -
174
-
175
-
176
-
177
-
178
-
179
-
180
-
181
-
182
-
183
-
184
-
185
-
186
-
187
-
188
 |
 |

2012/13 Annual Report Lenovo Group Limited 161
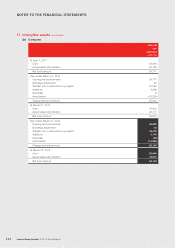
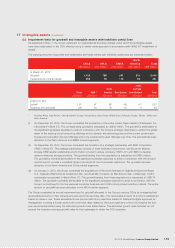
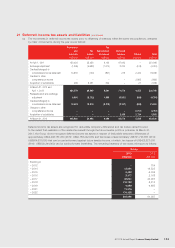
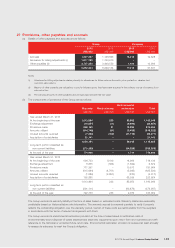
21 Deferred income tax assets and liabilities (continued)
(a) The movements in deferred income tax assets (prior to offsetting of balances within the same tax jurisdiction), analyzed
by major components, during the year are as follows:
Provisions
and
accruals
Tax
losses
Tax
depreciation
allowance
Deferred
revenue Others Total
US$’000 US$’000 US$’000 US$’000 US$’000 US$’000
At April 1, 2011 150,420 25,456 8,130 67,092 – 251,098
Exchange adjustment (1,245) (5,688) (1,014) 3,704 (518) (4,761)
Credited/(charged) to
consolidated income statement 74,935 (100) (897) 278 2,249 76,465
Credited to other
comprehensive income – – – – 2,895 2,895
Acquisition of subsidiaries 269 6,431 342 – 27 7,069
At March 31, 2012 and
April 1, 2013 224,379 26,099 6,561 71,074 4,653 332,766
Reclassification and exchange
adjustment 8,090 (8,732) 1,895 (5,551) (458) (4,756)
Credited/(charged) to
consolidated income statement 13,423 13,319 (2,370) (2,107) (584) 21,681
Charged to other
comprehensive income – – – – (1,757) (1,757)
Acquisition of subsidiaries – – – 2,158 3,734 5,892
At March 31, 2013 245,892 30,686 6,086 65,574 5,588 353,826
Deferred income tax assets are recognized for deductible temporary differences and tax losses carried forward
to the extent that realization of the related tax benefit through the future taxable profits is probable. At March 31,
2013, the Group did not recognize deferred income tax assets in respect of deductible temporary differences of
approximately US$2,406,161,000 (2012: US$2,166,242,000) and tax losses of approximately US$791,723,000 (2012:
US$584,631,000) that can be carried forward against future taxable income, of which, tax losses of US$428,827,000
(2012: US$503,244,000) can be carried forward indefinitely. The remaining balances of tax losses will expire as follows:
Group
2013 2012
US$’000 US$’000
Expiring in
– 2012 –754
– 2014 13,051 14,525
– 2015 6,423 6,795
– 2016 2,177 2,168
– 2017 35,631 44,067
– 2018 115,722 8,213
– 2019 4,489 4,865
– 2021 11,275 –
– 2022 174,128 –
362,896 81,387