Lenovo 2013 Annual Report Download - page 144
Download and view the complete annual report
Please find page 144 of the 2013 Lenovo annual report below. You can navigate through the pages in the report by either clicking on the pages listed below, or by using the keyword search tool below to find specific information within the annual report.-
 1
1 -
2
-
3
-
4
-
5
-
6
-
7
-
8
-
9
-
10
-
11
-
12
-
13
-
14
-
15
-
16
-
17
-
18
-
19
-
20
-
21
-
22
-
23
-
24
-
25
-
26
-
27
-
28
-
29
-
30
-
31
-
32
-
33
-
34
-
35
-
36
-
37
-
38
-
39
-
40
-
41
-
42
-
43
-
44
-
45
-
46
-
47
-
48
-
49
-
50
-
51
-
52
-
53
-
54
-
55
-
56
-
57
-
58
-
59
-
60
-
61
-
62
-
63
-
64
-
65
-
66
-
67
-
68
-
69
-
70
-
71
-
72
-
73
-
74
-
75
-
76
-
77
-
78
-
79
-
80
-
81
-
82
-
83
-
84
-
85
-
86
-
87
-
88
-
89
-
90
-
91
-
92
-
93
-
94
-
95
-
96
-
97
-
98
-
99
-
100
-
101
-
102
-
103
-
104
-
105
-
106
-
107
-
108
-
109
-
110
-
111
-
112
-
113
-
114
-
115
-
116
-
117
-
118
-
119
-
120
-
121
-
122
-
123
-
124
-
125
-
126
-
127
-
128
-
129
-
130
-
131
-
132
-
133
-
 134
134 -
 135
135 -
 136
136 -
 137
137 -
 138
138 -
 139
139 -
 140
140 -
 141
141 -
 142
142 -
 143
143 -
 144
144 -
 145
145 -
 146
146 -
 147
147 -
 148
148 -
 149
149 -
 150
150 -
 151
151 -
 152
152 -
 153
153 -
 154
154 -
155
-
156
-
157
-
158
-
159
-
160
-
161
-
162
-
163
-
164
-
165
-
166
-
167
-
168
-
169
-
170
-
171
-
172
-
173
-
174
-
175
-
176
-
177
-
178
-
179
-
180
-
181
-
182
-
183
-
184
-
185
-
186
-
187
-
188
 |
 |
NOTES TO THE FINANCIAL STATEMENTS
Lenovo Group Limited 2012/13 Annual Report
142
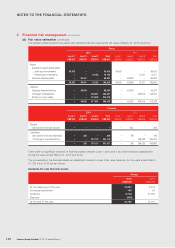
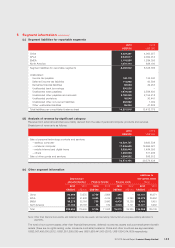
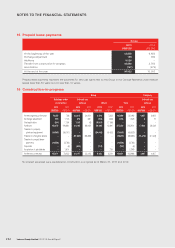
5 Segment information (continued)
(a) Segment revenue and adjusted pre-tax income/(loss) for reportable segments
2013 2012
Revenue Revenue Adjusted
from Adjusted from pre-tax
external pre-tax external income/
customers income customers (loss)
US$’000 US$’000 US$’000 US$’000
China 14,538,534 677,938 12,395,324 568,565
APLA 6,860,380 23,591 6,337,521 (455)
EMEA 7,535,483 146,674 6,295,860 82,729
North America 4,939,004 167,558 4,545,733 160,705
Segment total 33,873,401 1,015,761 29,574,438 811,544
Unallocated:
Headquarters and corporate expenses (242,954) (246,028)
Restructuring costs 87 3,212
Finance income 36,775 31,625
Finance costs (27,559) (18,258)
De-recognition of contingent
consideration 19,861 –
Net (loss)/gain on disposal of
available-for-sale financial assets
and investments (316) 1,104
Dividend income from
available-for-sale financial assets 362 95
Share of losses of associates and
jointly controlled entities (718) (851)
Consolidated profit before taxation 801,299 582,443
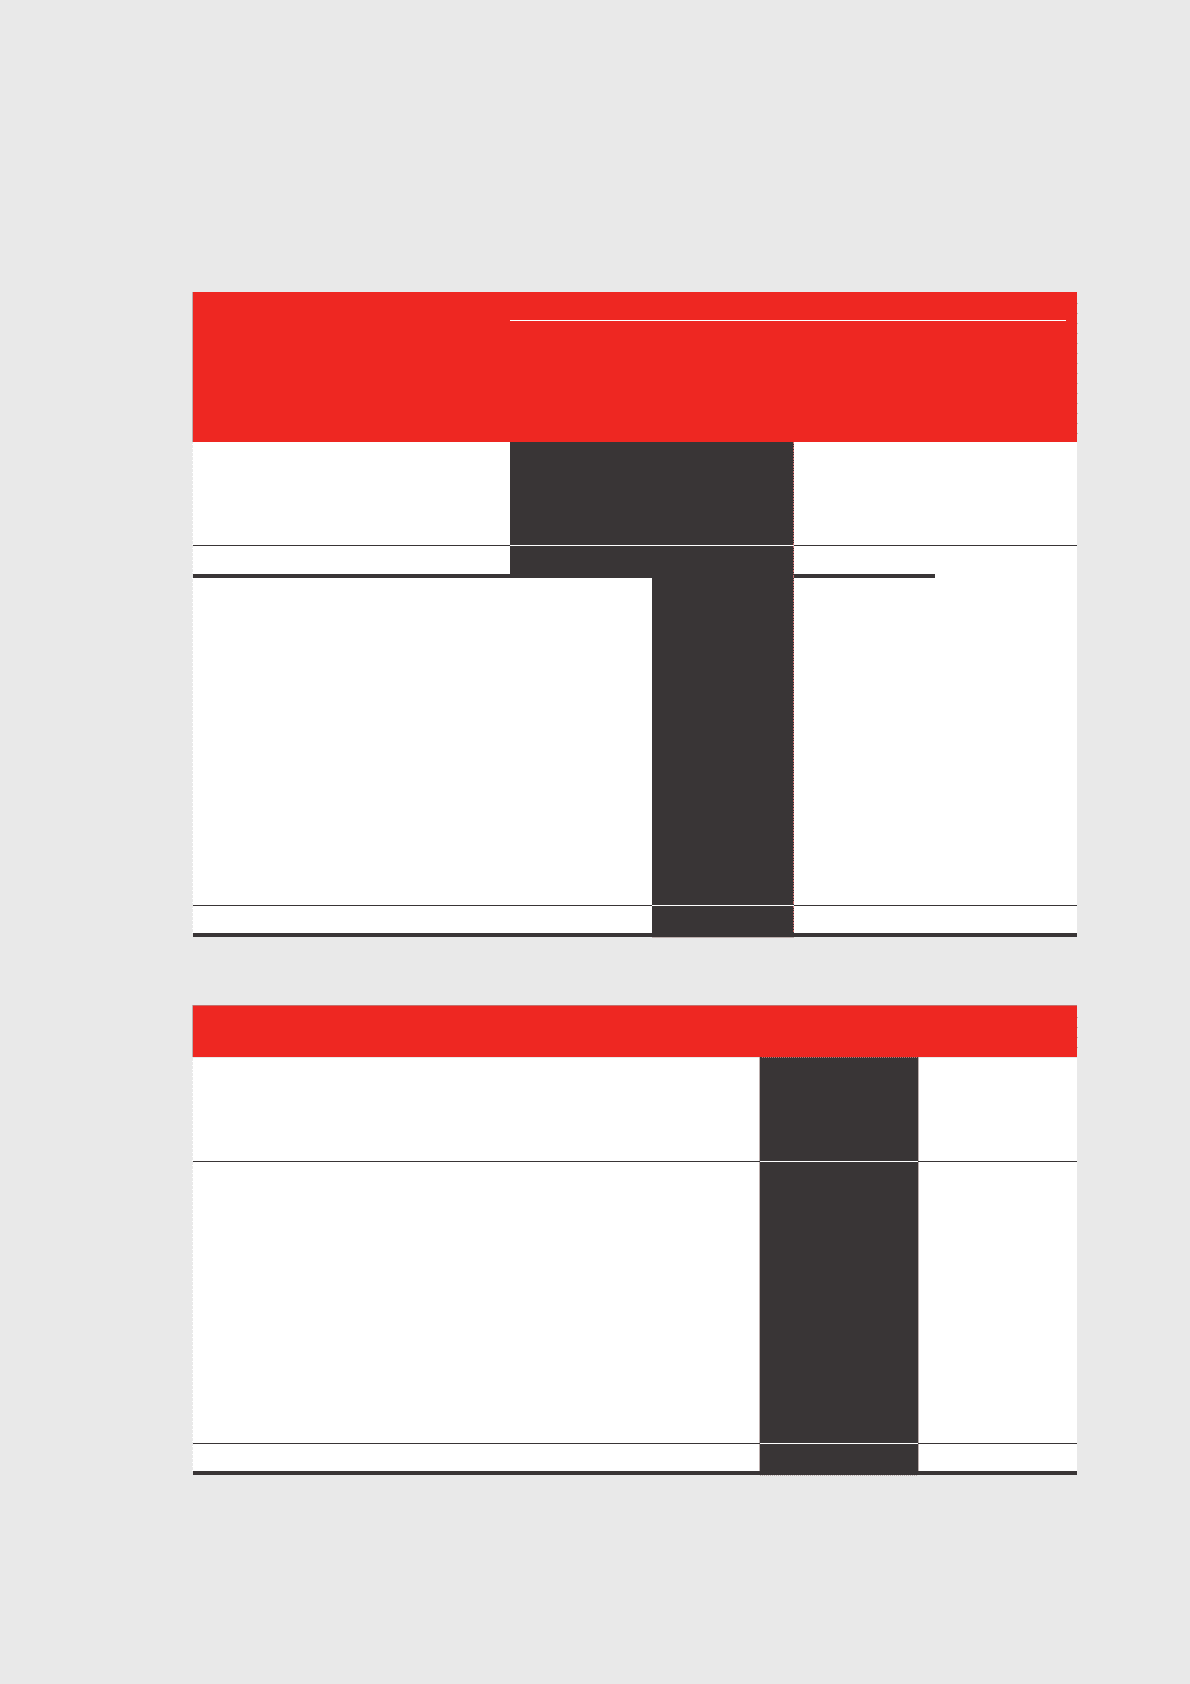
(b) Segment assets for reportable segments
2013 2012
US$’000 US$’000
China 4,919,934 4,580,746
APLA 3,298,909 3,036,960
EMEA 1,928,011 2,096,253
North America 1,073,719 786,670
Segment assets for reportable segments 11,220,573 10,500,629
Unallocated:
Deferred income tax assets 349,389 332,493
Derivative financial assets 99,491 62,883
Available-for-sale financial assets 69,962 71,946
Interests in associates and jointly controlled entities 2,763 3,410
Unallocated bank deposits and cash and cash equivalents 2,093,983 2,291,250
Unallocated inventories 597,239 356,677
Unallocated deposits, prepayments and other receivables 2,253,370 2,130,468
Income tax recoverable 58,822 70,406
Other unallocated assets 136,405 40,586
Total assets per consolidated balance sheet 16,881,997 15,860,748