Lenovo 2013 Annual Report Download - page 26
Download and view the complete annual report
Please find page 26 of the 2013 Lenovo annual report below. You can navigate through the pages in the report by either clicking on the pages listed below, or by using the keyword search tool below to find specific information within the annual report.-
 1
1 -
2
-
3
-
4
-
5
-
6
-
7
-
8
-
9
-
10
-
11
-
12
-
13
-
14
-
15
-
 16
16 -
 17
17 -
 18
18 -
 19
19 -
 20
20 -
 21
21 -
 22
22 -
 23
23 -
 24
24 -
 25
25 -
 26
26 -
 27
27 -
 28
28 -
 29
29 -
 30
30 -
 31
31 -
 32
32 -
 33
33 -
 34
34 -
 35
35 -
 36
36 -
37
-
38
-
39
-
40
-
41
-
42
-
43
-
44
-
45
-
46
-
47
-
48
-
49
-
50
-
51
-
52
-
53
-
54
-
55
-
56
-
57
-
58
-
59
-
60
-
61
-
62
-
63
-
64
-
65
-
66
-
67
-
68
-
69
-
70
-
71
-
72
-
73
-
74
-
75
-
76
-
77
-
78
-
79
-
80
-
81
-
82
-
83
-
84
-
85
-
86
-
87
-
88
-
89
-
90
-
91
-
92
-
93
-
94
-
95
-
96
-
97
-
98
-
99
-
100
-
101
-
102
-
103
-
104
-
105
-
106
-
107
-
108
-
109
-
110
-
111
-
112
-
113
-
114
-
115
-
116
-
117
-
118
-
119
-
120
-
121
-
122
-
123
-
124
-
125
-
126
-
127
-
128
-
129
-
130
-
131
-
132
-
133
-
134
-
135
-
136
-
137
-
138
-
139
-
140
-
141
-
142
-
143
-
144
-
145
-
146
-
147
-
148
-
149
-
150
-
151
-
152
-
153
-
154
-
155
-
156
-
157
-
158
-
159
-
160
-
161
-
162
-
163
-
164
-
165
-
166
-
167
-
168
-
169
-
170
-
171
-
172
-
173
-
174
-
175
-
176
-
177
-
178
-
179
-
180
-
181
-
182
-
183
-
184
-
185
-
186
-
187
-
188
 |
 |

Lenovo Group Limited 2012/13 Annual Report
24
MANAGEMENT’S DISCUSSION & ANALYSIS
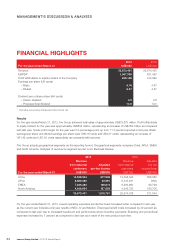
FINANCIAL HIGHLIGHTS
2013 2012
For the year ended March 31 US$’000 US$’000
Revenue 33,873,401 29,574,438
EBITDA* 1,067,339 821,497
Profit attributable to equity holders of the Company 635,148 472,992
Earnings per share (US cents)
– Basic 6.16 4.67
– Diluted 6.07 4.57
Dividend per ordinary share (HK cents)
– Interim dividend 4.5 3.8
– Proposed final dividend 14.0 10.0
* Excluding restructuring charges and other income, net
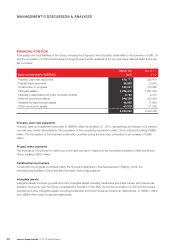
Results
For the year ended March 31, 2013, the Group achieved total sales of approximately US$33,873 million. Profit attributable
to equity holders for the year was approximately US$635 million, representing an increase of US$162 million as compared
with last year. Gross profit margin for the year was 0.3 percentage point up from 11.7 percent reported in last year. Basic
earnings per share and diluted earnings per share were US6.16 cents and US6.07 cents, representing an increase of
US1.49 cents and US1.50 cents respectively as compared with last year.
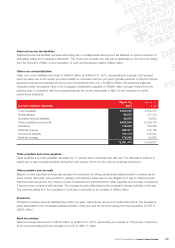
The Group adopts geographical segments as the reporting format. Geographical segments comprise China, APLA, EMEA
and North America. Analyses of revenue by segment are set out in Business Review.
2013 2012
Revenue
from external
customers
Adjusted
pre-tax income
Revenue
from external
customers
Adjusted
pre-tax
income/(loss)
For the year ended March 31 US$’000 US$’000 US$’000 US$’000
China 14,538,534 677,938 12,395,324 568,565
APLA 6,860,380 23,591 6,337,521 (455)
EMEA 7,535,483 146,674 6,295,860 82,729
North America 4,939,004 167,558 4,545,733 160,705
33,873,401 1,015,761 29,574,438 811,544
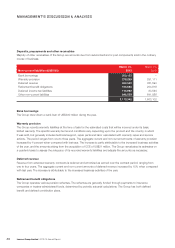
For the year ended March 31, 2013, overall operating expenses across the board increased when compared to last year
as the current year includes a full year results of NEC JV and Medion. Employee benefit costs increased by 22 percent as
compared to last year due to increased headcount and performance-driven incentive payments. Branding and promotional
expenses increased by 7 percent as compared to last year as a result of the new product launches.