Lenovo 2013 Annual Report Download - page 19
Download and view the complete annual report
Please find page 19 of the 2013 Lenovo annual report below. You can navigate through the pages in the report by either clicking on the pages listed below, or by using the keyword search tool below to find specific information within the annual report.-
 1
1 -
2
-
3
-
4
-
5
-
6
-
7
-
8
-
 9
9 -
 10
10 -
 11
11 -
 12
12 -
 13
13 -
 14
14 -
 15
15 -
 16
16 -
 17
17 -
 18
18 -
 19
19 -
 20
20 -
 21
21 -
 22
22 -
 23
23 -
 24
24 -
 25
25 -
 26
26 -
 27
27 -
 28
28 -
 29
29 -
30
-
31
-
32
-
33
-
34
-
35
-
36
-
37
-
38
-
39
-
40
-
41
-
42
-
43
-
44
-
45
-
46
-
47
-
48
-
49
-
50
-
51
-
52
-
53
-
54
-
55
-
56
-
57
-
58
-
59
-
60
-
61
-
62
-
63
-
64
-
65
-
66
-
67
-
68
-
69
-
70
-
71
-
72
-
73
-
74
-
75
-
76
-
77
-
78
-
79
-
80
-
81
-
82
-
83
-
84
-
85
-
86
-
87
-
88
-
89
-
90
-
91
-
92
-
93
-
94
-
95
-
96
-
97
-
98
-
99
-
100
-
101
-
102
-
103
-
104
-
105
-
106
-
107
-
108
-
109
-
110
-
111
-
112
-
113
-
114
-
115
-
116
-
117
-
118
-
119
-
120
-
121
-
122
-
123
-
124
-
125
-
126
-
127
-
128
-
129
-
130
-
131
-
132
-
133
-
134
-
135
-
136
-
137
-
138
-
139
-
140
-
141
-
142
-
143
-
144
-
145
-
146
-
147
-
148
-
149
-
150
-
151
-
152
-
153
-
154
-
155
-
156
-
157
-
158
-
159
-
160
-
161
-
162
-
163
-
164
-
165
-
166
-
167
-
168
-
169
-
170
-
171
-
172
-
173
-
174
-
175
-
176
-
177
-
178
-
179
-
180
-
181
-
182
-
183
-
184
-
185
-
186
-
187
-
188
 |
 |

PIO
NE
ER
PIO
0 20406080100
2012/13 Annual Report Lenovo Group Limited 17
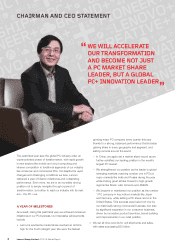
successful transactions will help to enhance Lenovo’s
products and services to its global customers and
contribute to our PC+ strategy.
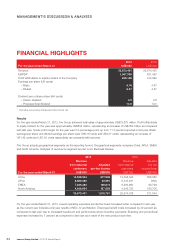
For the fiscal year ended March 31, 2013, the Group’s
consolidated revenue increased by 15 percent year-on-
year to record-high US$33,873 million. Under personal
technology products and services, revenue of the Group’s
PC and related business were US$29,749 million,
representing a year-on-year increase of 9 percent; whilst
the revenue of MIDH business, which was largely from
smartphone revenue in China, increased 105 percent year-
on-year to US$3,039 million. Meanwhile, revenue of other
goods and services were US$1,085 million.
The Group’s gross profit increased by 18 percent year-on-
year to US$4,074 million and gross margin increased from
11.7 percent in the previous fiscal year to 12.0 percent,
driven by effective margin management, scaling benefits
from growth in shipments and stringent cost controls.
Operating expenses increased by 14 percent year-on-
year to US$3,274 million, with an expenses-to-revenue
ratio of 9.7 percent. The Group continued to leverage
scaling benefits from strong shipment growth, even while
continuing to investment in product innovation, branding,
MIDH business and emerging markets, to drive long-term
sustainable growth and better profitability. This resulted
in a flat expenses-to-revenue ratio compared to last year.
The Group achieved a record-high profit before taxation of
US$801 million and profit attributable to equity holders of
the company amounted US$635 million, representing an
increase of 38 percent and 34 percent, respectively, from
the previous fiscal year.
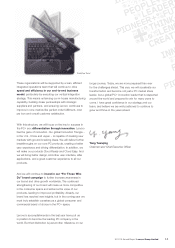
PERFORMANCE OF GEOGRAPHIES
During the year ended March 31, 2013, Lenovo achieved
strong performance in all geographies where it has
operations, gaining PC market share across the board in
China, EMEA, NA and Asia Pacific Latin America (APLA)
markets. The Group achieved record high PC market share
in China, EMEA, NA and APLA.
Lenovo ranked number one in two of the top three PC
markets in the world, namely China and Japan, in the fiscal
year 2012/13.
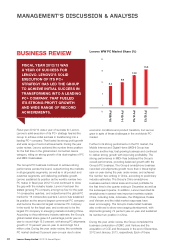
China
China accounted for 43 percent of the Group’s total
revenue. China’s PC market was affected by the
government leadership changes and budget control, and
softer economic growth, leading to a decline by 5 percent
year-on-year during the fiscal year according to preliminary
industry estimates.
During the fiscal year, Lenovo continued to outperform the
market and extend its leadership in China through its solid
strategic execution to protect mature cities while at the
same time attacking for growth in emerging smaller cities
and rural areas, where demand is stronger due to low PC
penetration. Lenovo’s unit shipments growth in China was
3 percent year-on-year for the fiscal year and market share
increased by 2.6 percentage point year-on-year to an all-
FY2013
Revenue by Geography (%)
FY2012
APLA
PRC
NA
EMEA
Lenovo PC Share by GEOs (%)
0
5
10
15
20
25
30
35
China
APLA
EMEA
NA
+2.6 pts
+1.6 pts
+3.1 pts +2.1 pts
43% 20% 22% 15%
43% 21% 21% 15%
%