Lenovo 2013 Annual Report Download - page 160
Download and view the complete annual report
Please find page 160 of the 2013 Lenovo annual report below. You can navigate through the pages in the report by either clicking on the pages listed below, or by using the keyword search tool below to find specific information within the annual report.-
 1
1 -
2
-
3
-
4
-
5
-
6
-
7
-
8
-
9
-
10
-
11
-
12
-
13
-
14
-
15
-
16
-
17
-
18
-
19
-
20
-
21
-
22
-
23
-
24
-
25
-
26
-
27
-
28
-
29
-
30
-
31
-
32
-
33
-
34
-
35
-
36
-
37
-
38
-
39
-
40
-
41
-
42
-
43
-
44
-
45
-
46
-
47
-
48
-
49
-
50
-
51
-
52
-
53
-
54
-
55
-
56
-
57
-
58
-
59
-
60
-
61
-
62
-
63
-
64
-
65
-
66
-
67
-
68
-
69
-
70
-
71
-
72
-
73
-
74
-
75
-
76
-
77
-
78
-
79
-
80
-
81
-
82
-
83
-
84
-
85
-
86
-
87
-
88
-
89
-
90
-
91
-
92
-
93
-
94
-
95
-
96
-
97
-
98
-
99
-
100
-
101
-
102
-
103
-
104
-
105
-
106
-
107
-
108
-
109
-
110
-
111
-
112
-
113
-
114
-
115
-
116
-
117
-
118
-
119
-
120
-
121
-
122
-
123
-
124
-
125
-
126
-
127
-
128
-
129
-
130
-
131
-
132
-
133
-
134
-
135
-
136
-
137
-
138
-
139
-
140
-
141
-
142
-
143
-
144
-
145
-
146
-
147
-
148
-
149
-
 150
150 -
 151
151 -
 152
152 -
 153
153 -
 154
154 -
 155
155 -
 156
156 -
 157
157 -
 158
158 -
 159
159 -
 160
160 -
 161
161 -
 162
162 -
 163
163 -
 164
164 -
 165
165 -
 166
166 -
 167
167 -
 168
168 -
 169
169 -
 170
170 -
171
-
172
-
173
-
174
-
175
-
176
-
177
-
178
-
179
-
180
-
181
-
182
-
183
-
184
-
185
-
186
-
187
-
188
 |
 |

NOTES TO THE FINANCIAL STATEMENTS
Lenovo Group Limited 2012/13 Annual Report
158
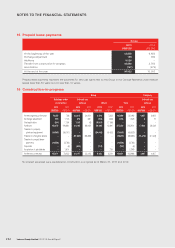
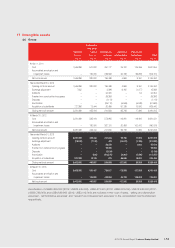
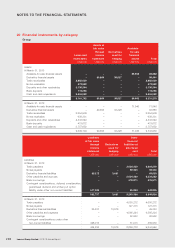
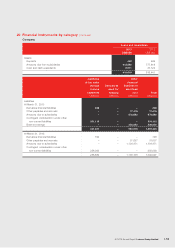
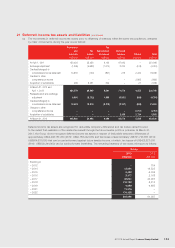
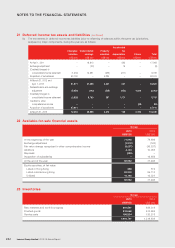
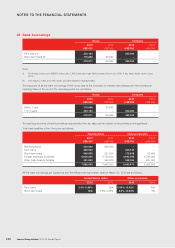
20 Financial instruments by category
Group
Loans and
receivables
Assets at
fair value
through
income
statement
Derivatives
used for
hedging
Available-
for-sale
financial
assets Total
US$’000 US$’000 US$’000 US$’000 US$’000
Assets
At March 31, 2013
Available-for-sale financial assets – – – 69,962 69,962
Derivative financial assets – 60,864 38,627 – 99,491
Trade receivables 2,885,039 – – – 2,885,039
Notes receivable 572,992 – – – 572,992
Deposits and other receivables 2,130,594 – – – 2,130,594
Bank deposits 119,055 – – – 119,055
Cash and cash equivalents 3,454,082 – – – 3,454,082
9,161,762 60,864 38,627 69,962 9,331,215
At March 31, 2012
Available-for-sale financial assets – – – 71,946 71,946
Derivative financial assets – 29,655 33,228 – 62,883
Trade receivables 2,354,909 – – – 2,354,909
Notes receivable 639,331 – – – 639,331
Deposits and other receivables 2,443,540 – – – 2,443,540
Bank deposits 413,672 – – – 413,672
Cash and cash equivalents 3,757,652 – – – 3,757,652
9,609,104 29,655 33,228 71,946 9,743,933
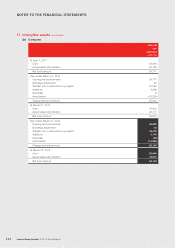
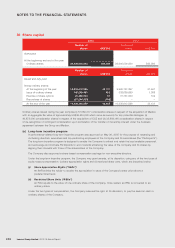
Liabilities
at fair value
through
income
statement
Derivatives
used for
hedging
Other
financial
liabilities at
amortized
cost Total
US$’000 US$’000 US$’000 US$’000
Liabilities
At March 31, 2013
Trade payables – – 3,624,500 3,624,500
Notes payable – – 99,503 99,503
Derivative financial liabilities 65,372 3,681 – 69,053
Other payables and accruals – – 5,034,562 5,034,562
Bank borrowings – – 478,971 478,971
Contingent considerations, deferred consideration,
guaranteed dividend and written put option
liability under other non-current liabilities 517,385 – 25,850 543,235
582,757 3,681 9,263,386 9,849,824
At March 31, 2012
Trade payables – – 4,050,272 4,050,272
Notes payable – – 127,315 127,315
Derivative financial liabilities 35,337 13,916 – 49,253
Other payables and payables – – 4,595,224 4,595,224
Bank borrowings – – 62,952 62,952
Contingent considerations under other
non-current liabilities 428,915 – 31,015 459,930
464,252 13,916 8,866,778 9,344,946