Lenovo 2013 Annual Report Download - page 28
Download and view the complete annual report
Please find page 28 of the 2013 Lenovo annual report below. You can navigate through the pages in the report by either clicking on the pages listed below, or by using the keyword search tool below to find specific information within the annual report.-
 1
1 -
2
-
3
-
4
-
5
-
6
-
7
-
8
-
9
-
10
-
11
-
12
-
13
-
14
-
15
-
16
-
17
-
 18
18 -
 19
19 -
 20
20 -
 21
21 -
 22
22 -
 23
23 -
 24
24 -
 25
25 -
 26
26 -
 27
27 -
 28
28 -
 29
29 -
 30
30 -
 31
31 -
 32
32 -
 33
33 -
 34
34 -
 35
35 -
 36
36 -
 37
37 -
 38
38 -
39
-
40
-
41
-
42
-
43
-
44
-
45
-
46
-
47
-
48
-
49
-
50
-
51
-
52
-
53
-
54
-
55
-
56
-
57
-
58
-
59
-
60
-
61
-
62
-
63
-
64
-
65
-
66
-
67
-
68
-
69
-
70
-
71
-
72
-
73
-
74
-
75
-
76
-
77
-
78
-
79
-
80
-
81
-
82
-
83
-
84
-
85
-
86
-
87
-
88
-
89
-
90
-
91
-
92
-
93
-
94
-
95
-
96
-
97
-
98
-
99
-
100
-
101
-
102
-
103
-
104
-
105
-
106
-
107
-
108
-
109
-
110
-
111
-
112
-
113
-
114
-
115
-
116
-
117
-
118
-
119
-
120
-
121
-
122
-
123
-
124
-
125
-
126
-
127
-
128
-
129
-
130
-
131
-
132
-
133
-
134
-
135
-
136
-
137
-
138
-
139
-
140
-
141
-
142
-
143
-
144
-
145
-
146
-
147
-
148
-
149
-
150
-
151
-
152
-
153
-
154
-
155
-
156
-
157
-
158
-
159
-
160
-
161
-
162
-
163
-
164
-
165
-
166
-
167
-
168
-
169
-
170
-
171
-
172
-
173
-
174
-
175
-
176
-
177
-
178
-
179
-
180
-
181
-
182
-
183
-
184
-
185
-
186
-
187
-
188
 |
 |

Lenovo Group Limited 2012/13 Annual Report
26
MANAGEMENT’S DISCUSSION & ANALYSIS
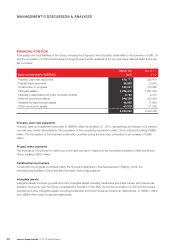
FINANCIAL POSITION
Total assets and total liabilities of the Group increased by 6 percent, which is partly attributable to the formation of EMC JV
and the acquisition of CCE and Stoneware during the year. Further analyses of the Group’s major balance sheet items are
set out below:
Non-current assets (US$’000)
March 31,
2013
March 31,
2012
Property, plant and equipment 479,777 392,474
Prepaid lease payments 36,522 13,552
Construction-in-progress 184,051 103,986
Intangible assets 3,326,418 3,091,205
Interests in associates and jointly controlled entities 2,763 3,410
Deferred income tax assets 349,389 332,493
Available-for-sale financial assets 69,962 71,946
Other non-current assets 43,378 31,282
4,492,260 4,040,348
Property, plant and equipment
Property, plant and equipment amounted to US$480 million as at March 31, 2013, representing an increase of 22 percent
over last year, mainly attributable to the completion of the manufacturing plants in Hefei, China, and Brazil totaling US$56
million. The completion of the business combination activities during the year also contributed to an increase of US$8
million.
Prepaid lease payments
The increase of 169 percent is mainly due to the land use right in respect of the manufacturing sites in Hefei and Wuhan,
China, totalling US$23 million.
Construction-in-progress
Construction-in-progress comprises mainly the Group’s investments in the headquarters in Beijing, China, the
manufacturing facilities in China and the information technology systems.
Intangible assets
Intangible assets comprise goodwill and other intangible assets including trademarks and trade names, and internal use
software. During the year, the Group completed the formation of the EMC JV and the acquisition of CCE and Stoneware.
Goodwill and other intangible assets, including trademarks and trade names and customer relationships, of US$201 million
and US$99 million were recognized respectively.