Lenovo 2013 Annual Report Download - page 161
Download and view the complete annual report
Please find page 161 of the 2013 Lenovo annual report below. You can navigate through the pages in the report by either clicking on the pages listed below, or by using the keyword search tool below to find specific information within the annual report.-
 1
1 -
2
-
3
-
4
-
5
-
6
-
7
-
8
-
9
-
10
-
11
-
12
-
13
-
14
-
15
-
16
-
17
-
18
-
19
-
20
-
21
-
22
-
23
-
24
-
25
-
26
-
27
-
28
-
29
-
30
-
31
-
32
-
33
-
34
-
35
-
36
-
37
-
38
-
39
-
40
-
41
-
42
-
43
-
44
-
45
-
46
-
47
-
48
-
49
-
50
-
51
-
52
-
53
-
54
-
55
-
56
-
57
-
58
-
59
-
60
-
61
-
62
-
63
-
64
-
65
-
66
-
67
-
68
-
69
-
70
-
71
-
72
-
73
-
74
-
75
-
76
-
77
-
78
-
79
-
80
-
81
-
82
-
83
-
84
-
85
-
86
-
87
-
88
-
89
-
90
-
91
-
92
-
93
-
94
-
95
-
96
-
97
-
98
-
99
-
100
-
101
-
102
-
103
-
104
-
105
-
106
-
107
-
108
-
109
-
110
-
111
-
112
-
113
-
114
-
115
-
116
-
117
-
118
-
119
-
120
-
121
-
122
-
123
-
124
-
125
-
126
-
127
-
128
-
129
-
130
-
131
-
132
-
133
-
134
-
135
-
136
-
137
-
138
-
139
-
140
-
141
-
142
-
143
-
144
-
145
-
146
-
147
-
148
-
149
-
150
-
 151
151 -
 152
152 -
 153
153 -
 154
154 -
 155
155 -
 156
156 -
 157
157 -
 158
158 -
 159
159 -
 160
160 -
 161
161 -
 162
162 -
 163
163 -
 164
164 -
 165
165 -
 166
166 -
 167
167 -
 168
168 -
 169
169 -
 170
170 -
 171
171 -
172
-
173
-
174
-
175
-
176
-
177
-
178
-
179
-
180
-
181
-
182
-
183
-
184
-
185
-
186
-
187
-
188
 |
 |
2012/13 Annual Report Lenovo Group Limited 159
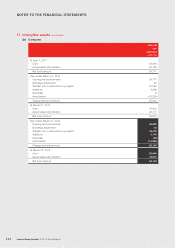
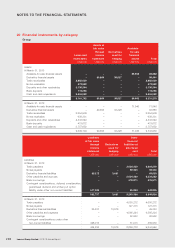
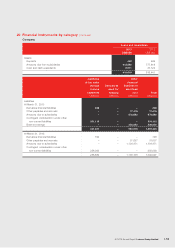
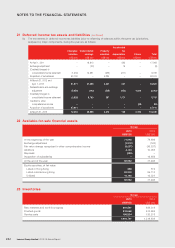
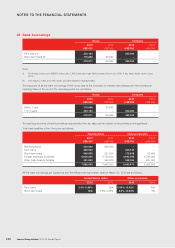
20 Financial instruments by category (continued)
Company
Loans and receivables
2013 2012
US$’000 US$’000
Assets
Deposits 448 499
Amounts due from subsidiaries 412,660 777,818
Cash and cash equivalents 6,511 37,124
419,619 815,441
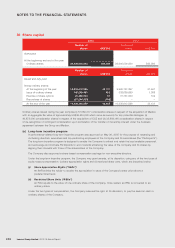
Liabilities
at fair value
through
income
statement
Derivatives
used for
hedging
Other
financial
liabilities at
amortized
cost Total
US$’000 US$’000 US$’000 US$’000
Liabilities
At March 31, 2013
Derivative financial liabilities 238 – – 238
Other payables and accruals – – 17,415 17,415
Amounts due to subsidiaries – – 676,663 676,663
Contingent consideration under other
non-current liabilities 301,113 – – 301,113
Bank borrowings – – 300,000 300,000
301,351 – 994,078 1,295,429
At March 31, 2012
Derivative financial liabilities 796 – – 796
Other payables and accruals – – 31,637 31,637
Amounts due to subsidiaries – – 1,104,471 1,104,471
Contingent consideration under other
non-current liabilities 256,093 – – 256,093
256,889 – 1,136,108 1,392,997