Lenovo 2013 Annual Report Download - page 118
Download and view the complete annual report
Please find page 118 of the 2013 Lenovo annual report below. You can navigate through the pages in the report by either clicking on the pages listed below, or by using the keyword search tool below to find specific information within the annual report.-
 1
1 -
2
-
3
-
4
-
5
-
6
-
7
-
8
-
9
-
10
-
11
-
12
-
13
-
14
-
15
-
16
-
17
-
18
-
19
-
20
-
21
-
22
-
23
-
24
-
25
-
26
-
27
-
28
-
29
-
30
-
31
-
32
-
33
-
34
-
35
-
36
-
37
-
38
-
39
-
40
-
41
-
42
-
43
-
44
-
45
-
46
-
47
-
48
-
49
-
50
-
51
-
52
-
53
-
54
-
55
-
56
-
57
-
58
-
59
-
60
-
61
-
62
-
63
-
64
-
65
-
66
-
67
-
68
-
69
-
70
-
71
-
72
-
73
-
74
-
75
-
76
-
77
-
78
-
79
-
80
-
81
-
82
-
83
-
84
-
85
-
86
-
87
-
88
-
89
-
90
-
91
-
92
-
93
-
94
-
95
-
96
-
97
-
98
-
99
-
100
-
101
-
102
-
103
-
104
-
105
-
106
-
107
-
 108
108 -
 109
109 -
 110
110 -
 111
111 -
 112
112 -
 113
113 -
 114
114 -
 115
115 -
 116
116 -
 117
117 -
 118
118 -
 119
119 -
 120
120 -
 121
121 -
 122
122 -
 123
123 -
 124
124 -
 125
125 -
 126
126 -
 127
127 -
 128
128 -
129
-
130
-
131
-
132
-
133
-
134
-
135
-
136
-
137
-
138
-
139
-
140
-
141
-
142
-
143
-
144
-
145
-
146
-
147
-
148
-
149
-
150
-
151
-
152
-
153
-
154
-
155
-
156
-
157
-
158
-
159
-
160
-
161
-
162
-
163
-
164
-
165
-
166
-
167
-
168
-
169
-
170
-
171
-
172
-
173
-
174
-
175
-
176
-
177
-
178
-
179
-
180
-
181
-
182
-
183
-
184
-
185
-
186
-
187
-
188
 |
 |
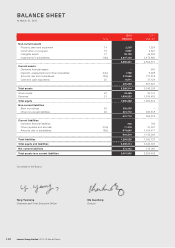
BALANCE SHEET
At March 31, 2013
Lenovo Group Limited 2012/13 Annual Report
116
2013 2012
Note US$’000 US$’000
Non-current assets
Property, plant and equipment 14 2,218 1,224
Construction-in-progress 16 3,967 4,607
Intangible assets 17 52,133 45,802
Investments in subsidiaries 18(a) 2,807,103 2,472,880
2,865,421 2,524,513
Current assets
Derivative financial assets –953
Deposits, prepayments and other receivables 24(c) 1,722 5,928
Amounts due from subsidiaries 18(b) 412,660 777,818
Cash and cash equivalents 25 6,511 37,124
420,893 821,823
Total assets 3,286,314 3,346,336
Share capital 30 33,465 33,131
Reserves 31 1,956,823 1,919,483
Total equity 1,990,288 1,952,614
Non-current liabilities
Bank borrowings 28 300,000 –
Other non-current liabilities 29 301,710 256,818
601,710 256,818
Current liabilities
Derivative financial liabilities 238 796
Other payables and accruals 27(a) 17,415 31,637
Amounts due to subsidiaries 18(b) 676,663 1,104,471
694,316 1,136,904
Total liabilities 1,296,026 1,393,722
Total equity and liabilities 3,286,314 3,346,336
Net current liabilities 273,423 315,081
Total assets less current liabilities 2,591,998 2,209,432
On behalf of the Board
Yang Yuanqing Ma Xuezheng
Chairman and Chief Executive Officer Director