Lenovo 2013 Annual Report Download - page 176
Download and view the complete annual report
Please find page 176 of the 2013 Lenovo annual report below. You can navigate through the pages in the report by either clicking on the pages listed below, or by using the keyword search tool below to find specific information within the annual report.-
 1
1 -
2
-
3
-
4
-
5
-
6
-
7
-
8
-
9
-
10
-
11
-
12
-
13
-
14
-
15
-
16
-
17
-
18
-
19
-
20
-
21
-
22
-
23
-
24
-
25
-
26
-
27
-
28
-
29
-
30
-
31
-
32
-
33
-
34
-
35
-
36
-
37
-
38
-
39
-
40
-
41
-
42
-
43
-
44
-
45
-
46
-
47
-
48
-
49
-
50
-
51
-
52
-
53
-
54
-
55
-
56
-
57
-
58
-
59
-
60
-
61
-
62
-
63
-
64
-
65
-
66
-
67
-
68
-
69
-
70
-
71
-
72
-
73
-
74
-
75
-
76
-
77
-
78
-
79
-
80
-
81
-
82
-
83
-
84
-
85
-
86
-
87
-
88
-
89
-
90
-
91
-
92
-
93
-
94
-
95
-
96
-
97
-
98
-
99
-
100
-
101
-
102
-
103
-
104
-
105
-
106
-
107
-
108
-
109
-
110
-
111
-
112
-
113
-
114
-
115
-
116
-
117
-
118
-
119
-
120
-
121
-
122
-
123
-
124
-
125
-
126
-
127
-
128
-
129
-
130
-
131
-
132
-
133
-
134
-
135
-
136
-
137
-
138
-
139
-
140
-
141
-
142
-
143
-
144
-
145
-
146
-
147
-
148
-
149
-
150
-
151
-
152
-
153
-
154
-
155
-
156
-
157
-
158
-
159
-
160
-
161
-
162
-
163
-
164
-
165
-
 166
166 -
 167
167 -
 168
168 -
 169
169 -
 170
170 -
 171
171 -
 172
172 -
 173
173 -
 174
174 -
 175
175 -
 176
176 -
 177
177 -
 178
178 -
 179
179 -
 180
180 -
 181
181 -
 182
182 -
 183
183 -
 184
184 -
 185
185 -
 186
186 -
187
-
188
 |
 |

NOTES TO THE FINANCIAL STATEMENTS
Lenovo Group Limited 2012/13 Annual Report
174
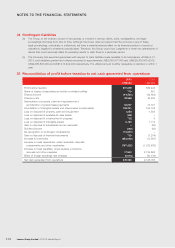
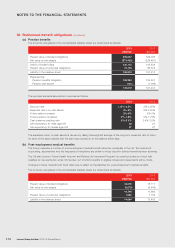
34 Contingent liabilities
(a) The Group, in the ordinary course of its business, is involved in various claims, suits, investigations, and legal
proceedings that arise from time to time. Although the Group does not expect that the outcome in any of these
legal proceedings, individually or collectively, will have a material adverse effect on its financial position or results of
operations, litigation is inherently unpredictable. Therefore, the Group could incur judgments or enter into settlements of
claims that could adversely affect its operating results or cash flows in a particular period.
(b) The Company has executed guarantees with respect to bank facilities made available to its subsidiaries. At March 31,
2013, such facilities granted and utilized amounted to approximately US$2,680,817,000 and US$229,308,000 (2012:
US$2,985,823,000 and US$1,414,442,000) respectively. The utilized amount is either repayable on demand or within 1
year.
35 Reconciliation of profit before taxation to net cash generated from operations
2013 2012
US$’000 US$’000
Profit before taxation 801,299 582,443
Share of losses of associates and jointly controlled entities 718 851
Finance income (44,881) (42,693)
Finance costs 42,869 43,484
Depreciation of property, plant and equipment and
amortization of prepaid lease payments 92,097 77,721
Amortization of intangible assets and share-based compensation 195,231 164,102
Loss on disposal of property, plant and equipment 1,353 1,505
Loss on disposal of available-for-sale assets 959 –
Loss on disposal of construction-in-progress 732 6
Loss on disposal of intangible assets 3,124 1,113
Gain on disposal of subsidiaries and an associate –(50)
Dividend income (362) (95)
De-recognition of contingent consideration (19,861) –
Gain on disposal of financial instruments 725 (7,274)
Increase in inventories (653,642) (13,587)
Increase in trade receivables, notes receivable, deposits,
prepayments and other receivables (187,202) (1,322,485)
Increase in trade payables, notes payable, provisions,
accruals and other payables 17,842 2,724,863
Effect of foreign exchange rate changes (5,618) (83,139)
Net cash generated from operations 245,383 2,126,765