Lenovo 2013 Annual Report Download - page 166
Download and view the complete annual report
Please find page 166 of the 2013 Lenovo annual report below. You can navigate through the pages in the report by either clicking on the pages listed below, or by using the keyword search tool below to find specific information within the annual report.-
 1
1 -
2
-
3
-
4
-
5
-
6
-
7
-
8
-
9
-
10
-
11
-
12
-
13
-
14
-
15
-
16
-
17
-
18
-
19
-
20
-
21
-
22
-
23
-
24
-
25
-
26
-
27
-
28
-
29
-
30
-
31
-
32
-
33
-
34
-
35
-
36
-
37
-
38
-
39
-
40
-
41
-
42
-
43
-
44
-
45
-
46
-
47
-
48
-
49
-
50
-
51
-
52
-
53
-
54
-
55
-
56
-
57
-
58
-
59
-
60
-
61
-
62
-
63
-
64
-
65
-
66
-
67
-
68
-
69
-
70
-
71
-
72
-
73
-
74
-
75
-
76
-
77
-
78
-
79
-
80
-
81
-
82
-
83
-
84
-
85
-
86
-
87
-
88
-
89
-
90
-
91
-
92
-
93
-
94
-
95
-
96
-
97
-
98
-
99
-
100
-
101
-
102
-
103
-
104
-
105
-
106
-
107
-
108
-
109
-
110
-
111
-
112
-
113
-
114
-
115
-
116
-
117
-
118
-
119
-
120
-
121
-
122
-
123
-
124
-
125
-
126
-
127
-
128
-
129
-
130
-
131
-
132
-
133
-
134
-
135
-
136
-
137
-
138
-
139
-
140
-
141
-
142
-
143
-
144
-
145
-
146
-
147
-
148
-
149
-
150
-
151
-
152
-
153
-
154
-
155
-
 156
156 -
 157
157 -
 158
158 -
 159
159 -
 160
160 -
 161
161 -
 162
162 -
 163
163 -
 164
164 -
 165
165 -
 166
166 -
 167
167 -
 168
168 -
 169
169 -
 170
170 -
 171
171 -
 172
172 -
 173
173 -
 174
174 -
 175
175 -
 176
176 -
177
-
178
-
179
-
180
-
181
-
182
-
183
-
184
-
185
-
186
-
187
-
188
 |
 |

NOTES TO THE FINANCIAL STATEMENTS
Lenovo Group Limited 2012/13 Annual Report
164
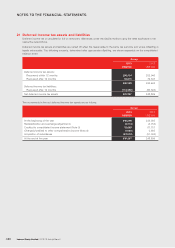
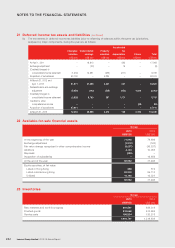
24 Receivables (continued)
(c) Details of deposits, prepayments and other receivables are as follows:
Group Company
2013 2012 2013 2012
US$’000 US$’000 US$’000 US$’000
Deposits 2,923 884 448 499
Other receivables (i) 2,127,671 2,442,656 555 513
Prepayments (ii) 1,104,871 859,513 719 4,916
3,235,465 3,303,053 1,722 5,928
Notes:
(i) Majority of other receivables of the Group are amounts due from subcontractors for part components sold in the ordinary course of
business.
(ii) The Group defers the cost of shipped products awaiting revenue recognition until the goods are delivered and revenue is
recognized. In-transit product shipments to customers of US$180 million as at March 31, 2013 (2012: US$392 million) are included
in prepayments.
(d) The carrying amounts of trade, notes and other receivables and deposits approximate their fair values. The maximum
exposure to credit risk at the balance sheet date is the fair value of each class of receivable mentioned above. The
Group does not hold any collateral as security.
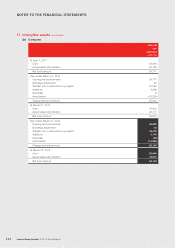
25 Bank deposits and cash and cash equivalents
Group Company
2013 2012 2013 2012
US$’000 US$’000 US$’000 US$’000
Bank deposits
– matured between three to twelve months 116,696 413,672 ––
– restricted bank balances 2,359 –––
119,055 413,672 ––
Cash and cash equivalents
– cash at bank and in hand 2,607,810 2,681,196 6,511 37,124
– money market funds 846,272 1,076,456 ––
3,454,082 3,757,652 6,511 37,124
3,573,137 4,171,324 6,511 37,124
Maximum exposure to credit risk 3,573,137 4,171,324 6,511 37,124
Effective annual interest rates 0%-12.42% 0%-10.78% 0%-0.6% 0%-0.25%
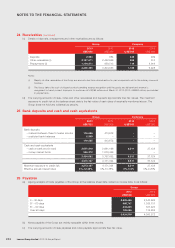
26 Payables
(a) Ageing analysis of trade payables of the Group at the balance sheet date, based on invoice date, is as follows:
Group
2013 2012
US$’000 US$’000
0 – 30 days 2,526,465 2,543,626
31 – 60 days 566,747 1,025,131
61 – 90 days 332,223 307,223
Over 90 days 199,065 174,292
3,624,500 4,050,272
(b) Notes payable of the Group are mainly repayable within three months.
(c) The carrying amounts of trade payables and notes payable approximate their fair value.