Lenovo 2013 Annual Report Download - page 173
Download and view the complete annual report
Please find page 173 of the 2013 Lenovo annual report below. You can navigate through the pages in the report by either clicking on the pages listed below, or by using the keyword search tool below to find specific information within the annual report.-
 1
1 -
2
-
3
-
4
-
5
-
6
-
7
-
8
-
9
-
10
-
11
-
12
-
13
-
14
-
15
-
16
-
17
-
18
-
19
-
20
-
21
-
22
-
23
-
24
-
25
-
26
-
27
-
28
-
29
-
30
-
31
-
32
-
33
-
34
-
35
-
36
-
37
-
38
-
39
-
40
-
41
-
42
-
43
-
44
-
45
-
46
-
47
-
48
-
49
-
50
-
51
-
52
-
53
-
54
-
55
-
56
-
57
-
58
-
59
-
60
-
61
-
62
-
63
-
64
-
65
-
66
-
67
-
68
-
69
-
70
-
71
-
72
-
73
-
74
-
75
-
76
-
77
-
78
-
79
-
80
-
81
-
82
-
83
-
84
-
85
-
86
-
87
-
88
-
89
-
90
-
91
-
92
-
93
-
94
-
95
-
96
-
97
-
98
-
99
-
100
-
101
-
102
-
103
-
104
-
105
-
106
-
107
-
108
-
109
-
110
-
111
-
112
-
113
-
114
-
115
-
116
-
117
-
118
-
119
-
120
-
121
-
122
-
123
-
124
-
125
-
126
-
127
-
128
-
129
-
130
-
131
-
132
-
133
-
134
-
135
-
136
-
137
-
138
-
139
-
140
-
141
-
142
-
143
-
144
-
145
-
146
-
147
-
148
-
149
-
150
-
151
-
152
-
153
-
154
-
155
-
156
-
157
-
158
-
159
-
160
-
161
-
162
-
 163
163 -
 164
164 -
 165
165 -
 166
166 -
 167
167 -
 168
168 -
 169
169 -
 170
170 -
 171
171 -
 172
172 -
 173
173 -
 174
174 -
 175
175 -
 176
176 -
 177
177 -
 178
178 -
 179
179 -
 180
180 -
 181
181 -
 182
182 -
 183
183 -
184
-
185
-
186
-
187
-
188
 |
 |

2012/13 Annual Report Lenovo Group Limited 171
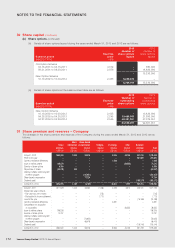
30 Share capital (continued)
(b) Share options (continued)
(ii) (continued)
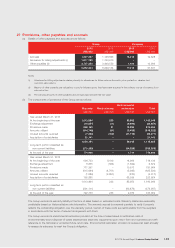
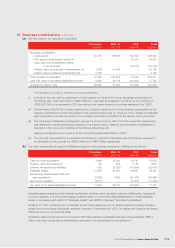
Details of share options exercised during the year ended March 31, 2012 are as follows:
Exercise date Exercise price
Market value
per ordinary
share at
exercise date
Number of
share options
exercised
Gross
proceeds
received
(MM.DD.YYYY) HK$ HK$ HK$
04.13.2011 to 04.26.2011 2.245 4.46-4.55 52,000 116,740
05.23.2011 to 05.23.2011 2.245 4.22-4.22 6,000 13,470
06.01.2011 to 06.27.2011 2.245 4.20-4.43 102,000 228,990
07.18.2011 to 07.26.2011 2.245 4.68-5.19 44,000 98,780
08.08.2011 to 08.31.2011 2.245 4.63-5.22 126,000 282,870
09.19.2011 to 09.28.2011 2.245 5.02-5.23 42,000 94,290
10.11.2011 to 10.31.2011 2.245 5.23-5.64 500,000 1,122,500
11.01.2011 to 11.28.2011 2.245 5.22-5.78 314,000 704,930
12.05.2011 to 12.07.2011 2.245 5.49-5.60 1,206,000 2,707,470
01.09.2012 to 01.31.2012 2.245 5.81-6.21 104,000 233,480
02.01.2012 to 02.29.2012 2.245 6.14-7.18 1,597,000 3,585,265
03.01.2012 to 03.30.2012 2.245 6.64-7.31 452,000 1,014,740
04.18.2011 to 04.20.2011 2.435 4.43-4.46 14,000 34,090
05.04.2011 to 05.31.2011 2.435 4.22-4.58 56,000 136,360
06.01.2011 to 06.01.2011 2.435 4.43-4.43 36,000 87,660
07.11.2011 to 07.27.2011 2.435 4.70-5.15 130,000 316,550
08.02.2011 to 08.31.2011 2.435 4.96-5.22 46,000 112,010
09.21.2011 to 09.28.2011 2.435 5.16-5.23 166,000 404,210
10.11.2011 to 10.26.2011 2.435 5.27-5.64 206,000 501,610
11.01.2011 to 11.29.2011 2.435 5.34-5.78 716,000 1,743,460
12.06.2011 to 12.14.2011 2.435 5.48-5.55 24,000 58,440
01.10.2012 to 01.31.2012 2.435 5.81-6.21 134,000 326,290
02.01.2012 to 02.29.2012 2.435 6.14-7.18 1,412,000 3,438,220
03.01.2012 to 03.30.2012 2.435 6.64-7.31 664,000 1,616,840
04.06.2011 to 04.27.2011 2.545 4.39-4.57 68,000 173,060
05.03.2011 to 05.31.2011 2.545 4.23-4.58 610,000 1,552,450
06.01.2011 to 06.28.2011 2.545 4.20-4.43 172,000 437,740
07.04.2011 to 07.27.2011 2.545 4.64-5.19 150,000 381,750
08.01.2011 to 08.31.2011 2.545 4.86-5.22 256,000 651,520
09.05.2011 to 09.21.2011 2.545 4.94-5.16 1,142,000 2,906,390
10.10.2011 to 10.31.2011 2.545 5.00-5.64 528,000 1,343,760
11.07.2011 to 11.29.2011 2.545 5.22-5.78 196,000 498,820
12.05.2011 to 12.14.2011 2.545 5.49-5.60 3,334,000 8,485,030
01.09.2012 to 01.18.2012 2.545 5.81-5.99 307,000 781,315
02.01.2012 to 02.29.2012 2.545 6.14-7.18 2,679,000 6,818,055
03.01.2012 to 03.30.2012 2.545 6.64-7.31 716,000 1,822,220
04.06.2011 to 04.27.2011 2.876 4.39-4.57 74,000 212,824
05.03.2011 to 05.31.2011 2.876 4.23-4.58 932,000 2,680,432
06.01.2011 to 06.29.2011 2.876 4.24-4.43 820,000 2,358,320
07.04.2011 to 07.27.2011 2.876 4.57-5.19 3,208,000 9,226,208
08.01.2011 to 08.30.2011 2.876 4.51-5.15 7,420,000 21,339,920
04.06.2011 to 04.07.2011 4.072 4.49-4.52 1,000,000 4,072,000
31,761,000 84,721,079
US$10,889,000