Lenovo 2013 Annual Report Download - page 27
Download and view the complete annual report
Please find page 27 of the 2013 Lenovo annual report below. You can navigate through the pages in the report by either clicking on the pages listed below, or by using the keyword search tool below to find specific information within the annual report.-
 1
1 -
2
-
3
-
4
-
5
-
6
-
7
-
8
-
9
-
10
-
11
-
12
-
13
-
14
-
15
-
16
-
 17
17 -
 18
18 -
 19
19 -
 20
20 -
 21
21 -
 22
22 -
 23
23 -
 24
24 -
 25
25 -
 26
26 -
 27
27 -
 28
28 -
 29
29 -
 30
30 -
 31
31 -
 32
32 -
 33
33 -
 34
34 -
 35
35 -
 36
36 -
 37
37 -
38
-
39
-
40
-
41
-
42
-
43
-
44
-
45
-
46
-
47
-
48
-
49
-
50
-
51
-
52
-
53
-
54
-
55
-
56
-
57
-
58
-
59
-
60
-
61
-
62
-
63
-
64
-
65
-
66
-
67
-
68
-
69
-
70
-
71
-
72
-
73
-
74
-
75
-
76
-
77
-
78
-
79
-
80
-
81
-
82
-
83
-
84
-
85
-
86
-
87
-
88
-
89
-
90
-
91
-
92
-
93
-
94
-
95
-
96
-
97
-
98
-
99
-
100
-
101
-
102
-
103
-
104
-
105
-
106
-
107
-
108
-
109
-
110
-
111
-
112
-
113
-
114
-
115
-
116
-
117
-
118
-
119
-
120
-
121
-
122
-
123
-
124
-
125
-
126
-
127
-
128
-
129
-
130
-
131
-
132
-
133
-
134
-
135
-
136
-
137
-
138
-
139
-
140
-
141
-
142
-
143
-
144
-
145
-
146
-
147
-
148
-
149
-
150
-
151
-
152
-
153
-
154
-
155
-
156
-
157
-
158
-
159
-
160
-
161
-
162
-
163
-
164
-
165
-
166
-
167
-
168
-
169
-
170
-
171
-
172
-
173
-
174
-
175
-
176
-
177
-
178
-
179
-
180
-
181
-
182
-
183
-
184
-
185
-
186
-
187
-
188
 |
 |

2012/13 Annual Report Lenovo Group Limited 25
PIO
NE
ER
PIO
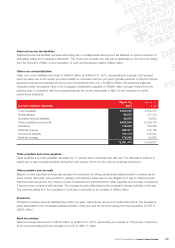
Further analyses of income and expense by function for the year ended March 31, 2013 are set out below:
Other income – net
This mainly represents the gain arising from the de-recognition of contingent consideration during the year. In October
2012, the Group completed the transfer of ownership interest under the business combination agreement with Medion.
Details are set out in Note 29(i) to the financial statements.
Selling and distribution expenses
Selling and distribution expenses for the year increased by 12 percent as compared to last year. This is principally
attributable to a US$39 million increase in promotional, branding and marketing activities and the increase in employee
benefit costs.
Administrative expenses
Administrative expenses for the year increased by 16 percent as compared to last year. This is mainly attributable to the
increase in employee benefit costs and a US$23 million increase in depreciation and amortization expenses.
Research and development expenses
Research and development spending for the year increased by 38 percent as compared to last year. The major part of the
increase is attributable to the increase in employee benefit costs, and an increase in R&D supplies & laboratory expenses
of US$32 million.
Other operating income – net
The net other operating income for the year comprises incentives and grants received of US$115 million, netted with
US$38 million net exchange loss; and other miscellaneous expenses.
The net other operating income in last year comprises incentives and grants received of US$30 million, net exchange gain
of US$5 million and other miscellaneous income, and is offset by a one-off license fee of US$35 million.
2013 2012
For the year ended March 31 US$’000 US$’000
Depreciation of property, plant and equipment and
amortization of prepaid lease payments 92,097 77,721
Amortization of intangible assets 117,507 97,684
Employee benefit costs, including 2,359,593 1,938,256
– long-term incentive awards 77,724 66,418
Rental expenses under operating leases 77,530 63,252