Lenovo 2013 Annual Report Download - page 178
Download and view the complete annual report
Please find page 178 of the 2013 Lenovo annual report below. You can navigate through the pages in the report by either clicking on the pages listed below, or by using the keyword search tool below to find specific information within the annual report.-
 1
1 -
2
-
3
-
4
-
5
-
6
-
7
-
8
-
9
-
10
-
11
-
12
-
13
-
14
-
15
-
16
-
17
-
18
-
19
-
20
-
21
-
22
-
23
-
24
-
25
-
26
-
27
-
28
-
29
-
30
-
31
-
32
-
33
-
34
-
35
-
36
-
37
-
38
-
39
-
40
-
41
-
42
-
43
-
44
-
45
-
46
-
47
-
48
-
49
-
50
-
51
-
52
-
53
-
54
-
55
-
56
-
57
-
58
-
59
-
60
-
61
-
62
-
63
-
64
-
65
-
66
-
67
-
68
-
69
-
70
-
71
-
72
-
73
-
74
-
75
-
76
-
77
-
78
-
79
-
80
-
81
-
82
-
83
-
84
-
85
-
86
-
87
-
88
-
89
-
90
-
91
-
92
-
93
-
94
-
95
-
96
-
97
-
98
-
99
-
100
-
101
-
102
-
103
-
104
-
105
-
106
-
107
-
108
-
109
-
110
-
111
-
112
-
113
-
114
-
115
-
116
-
117
-
118
-
119
-
120
-
121
-
122
-
123
-
124
-
125
-
126
-
127
-
128
-
129
-
130
-
131
-
132
-
133
-
134
-
135
-
136
-
137
-
138
-
139
-
140
-
141
-
142
-
143
-
144
-
145
-
146
-
147
-
148
-
149
-
150
-
151
-
152
-
153
-
154
-
155
-
156
-
157
-
158
-
159
-
160
-
161
-
162
-
163
-
164
-
165
-
166
-
167
-
 168
168 -
 169
169 -
 170
170 -
 171
171 -
 172
172 -
 173
173 -
 174
174 -
 175
175 -
 176
176 -
 177
177 -
 178
178 -
 179
179 -
 180
180 -
 181
181 -
 182
182 -
 183
183 -
 184
184 -
 185
185 -
 186
186 -
 187
187 -
 188
188
 |
 |

NOTES TO THE FINANCIAL STATEMENTS
Lenovo Group Limited 2012/13 Annual Report
176
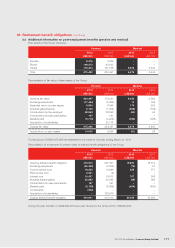
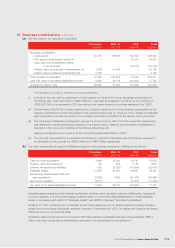
36 Retirement benefit obligations (continued)
(a) Pension benefits
The amounts recognized in the consolidated balance sheet are determined as follows:
2013 2012
US$’000 US$’000
Present value of funded obligations 405,537 329,335
Fair value of plan assets (275,422) (224,497)
Deficit of funded plans 130,115 104,838
Present value of unfunded obligations 19,104 86,575
Liability in the balance sheet 149,219 191,413
Representing:
Pension benefits obligation 149,340 192,461
Pension plan assets (121) (1,048)
149,219 191,413
The principal actuarial assumptions used are as follows:
2013 2012
Discount rate 1.75%-3.5% 2%-3.25%
Expected return on plan assets 2%-5% 2%-3.25%
Future salary increases 2%-5% 2%-5%
Future pension increases 0%-1.8% 0%-1.75%
Cash balance crediting rate 2%-2.2% 2.4%-2.5%
Life expectancy for male aged 60 23 23
Life expectancy for female aged 60 27 27
The expected return on plan assets is derived by taking the weighted average of the long term expected rate of return
on each of the asset classes that the plan was invested in at the balance sheet date.
(b) Post-employment medical benefits
The Group operates a number of post-employment medical benefit schemes, principally in the US. The method of
accounting, assumptions and the frequency of valuations are similar to those used for defined benefit pension schemes.
The US plan (Lenovo Future Health Account and Retiree Life Insurance Program) is currently funded by a trust that
qualifies for tax exemption under US tax law, out of which benefits to eligible retirees and dependents will be made.
Changes in future medical cost trend rates has no effect on the liabilities for post-employment medical benefits.
The amounts recognized in the consolidated balance sheet are determined as follows:
2013 2012
US$’000 US$’000
Present value of funded obligations 18,676 18,111
Fair value of plan assets (5,878) (6,445)
12,798 11,666
Present value of unfunded obligations 1,866 1,739
Liability in the balance sheet 14,664 13,405