Lenovo 2013 Annual Report Download - page 116
Download and view the complete annual report
Please find page 116 of the 2013 Lenovo annual report below. You can navigate through the pages in the report by either clicking on the pages listed below, or by using the keyword search tool below to find specific information within the annual report.-
 1
1 -
2
-
3
-
4
-
5
-
6
-
7
-
8
-
9
-
10
-
11
-
12
-
13
-
14
-
15
-
16
-
17
-
18
-
19
-
20
-
21
-
22
-
23
-
24
-
25
-
26
-
27
-
28
-
29
-
30
-
31
-
32
-
33
-
34
-
35
-
36
-
37
-
38
-
39
-
40
-
41
-
42
-
43
-
44
-
45
-
46
-
47
-
48
-
49
-
50
-
51
-
52
-
53
-
54
-
55
-
56
-
57
-
58
-
59
-
60
-
61
-
62
-
63
-
64
-
65
-
66
-
67
-
68
-
69
-
70
-
71
-
72
-
73
-
74
-
75
-
76
-
77
-
78
-
79
-
80
-
81
-
82
-
83
-
84
-
85
-
86
-
87
-
88
-
89
-
90
-
91
-
92
-
93
-
94
-
95
-
96
-
97
-
98
-
99
-
100
-
101
-
102
-
103
-
104
-
105
-
 106
106 -
 107
107 -
 108
108 -
 109
109 -
 110
110 -
 111
111 -
 112
112 -
 113
113 -
 114
114 -
 115
115 -
 116
116 -
 117
117 -
 118
118 -
 119
119 -
 120
120 -
 121
121 -
 122
122 -
 123
123 -
 124
124 -
 125
125 -
 126
126 -
127
-
128
-
129
-
130
-
131
-
132
-
133
-
134
-
135
-
136
-
137
-
138
-
139
-
140
-
141
-
142
-
143
-
144
-
145
-
146
-
147
-
148
-
149
-
150
-
151
-
152
-
153
-
154
-
155
-
156
-
157
-
158
-
159
-
160
-
161
-
162
-
163
-
164
-
165
-
166
-
167
-
168
-
169
-
170
-
171
-
172
-
173
-
174
-
175
-
176
-
177
-
178
-
179
-
180
-
181
-
182
-
183
-
184
-
185
-
186
-
187
-
188
 |
 |
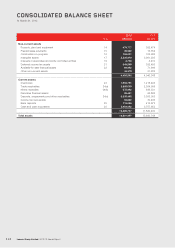
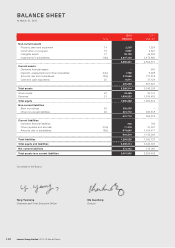
CONSOLIDATED BALANCE SHEET
At March 31, 2013
Lenovo Group Limited 2012/13 Annual Report
114
2013 2012
Note US$’000 US$’000
Non-current assets
Property, plant and equipment 14 479,777 392,474
Prepaid lease payments 15 36,522 13,552
Construction-in-progress 16 184,051 103,986
Intangible assets 17 3,326,418 3,091,205
Interests in associates and jointly controlled entities 19 2,763 3,410
Deferred income tax assets 21 349,389 332,493
Available-for-sale financial assets 22 69,962 71,946
Other non-current assets 43,378 31,282
4,492,260 4,040,348
Current assets
Inventories 23 1,964,791 1,218,494
Trade receivables 24(a) 2,885,039 2,354,909
Notes receivable 24(b) 572,992 639,331
Derivative financial assets 99,491 62,883
Deposits, prepayments and other receivables 24(c) 3,235,465 3,303,053
Income tax recoverable 58,822 70,406
Bank deposits 25 119,055 413,672
Cash and cash equivalents 25 3,454,082 3,757,652
12,389,737 11,820,400
Total assets 16,881,997 15,860,748