Lenovo 2013 Annual Report Download - page 120
Download and view the complete annual report
Please find page 120 of the 2013 Lenovo annual report below. You can navigate through the pages in the report by either clicking on the pages listed below, or by using the keyword search tool below to find specific information within the annual report.-
 1
1 -
2
-
3
-
4
-
5
-
6
-
7
-
8
-
9
-
10
-
11
-
12
-
13
-
14
-
15
-
16
-
17
-
18
-
19
-
20
-
21
-
22
-
23
-
24
-
25
-
26
-
27
-
28
-
29
-
30
-
31
-
32
-
33
-
34
-
35
-
36
-
37
-
38
-
39
-
40
-
41
-
42
-
43
-
44
-
45
-
46
-
47
-
48
-
49
-
50
-
51
-
52
-
53
-
54
-
55
-
56
-
57
-
58
-
59
-
60
-
61
-
62
-
63
-
64
-
65
-
66
-
67
-
68
-
69
-
70
-
71
-
72
-
73
-
74
-
75
-
76
-
77
-
78
-
79
-
80
-
81
-
82
-
83
-
84
-
85
-
86
-
87
-
88
-
89
-
90
-
91
-
92
-
93
-
94
-
95
-
96
-
97
-
98
-
99
-
100
-
101
-
102
-
103
-
104
-
105
-
106
-
107
-
108
-
109
-
 110
110 -
 111
111 -
 112
112 -
 113
113 -
 114
114 -
 115
115 -
 116
116 -
 117
117 -
 118
118 -
 119
119 -
 120
120 -
 121
121 -
 122
122 -
 123
123 -
 124
124 -
 125
125 -
 126
126 -
 127
127 -
 128
128 -
 129
129 -
 130
130 -
131
-
132
-
133
-
134
-
135
-
136
-
137
-
138
-
139
-
140
-
141
-
142
-
143
-
144
-
145
-
146
-
147
-
148
-
149
-
150
-
151
-
152
-
153
-
154
-
155
-
156
-
157
-
158
-
159
-
160
-
161
-
162
-
163
-
164
-
165
-
166
-
167
-
168
-
169
-
170
-
171
-
172
-
173
-
174
-
175
-
176
-
177
-
178
-
179
-
180
-
181
-
182
-
183
-
184
-
185
-
186
-
187
-
188
 |
 |

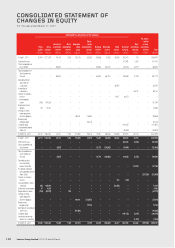
CONSOLIDATED STATEMENT OF
CHANGES IN EQUITY
For the year ended March 31, 2013
Lenovo Group Limited 2012/13 Annual Report
118
Attributable to equity holders of the Company
Share
capital
Share
premium
Investment
revaluation
reserve
Share
redemption
reserve
Employee
share
trusts
Share-
based
compensation
reserve
Hedging
reserve
Exchange
reserve
Other
reserve
Retained
earnings
Non-
controlling
interests
Put option
written
on non-
controlling
interest Total
US$’000 US$’000 US$’000 US$’000 US$’000 US$’000 US$’000 US$’000 US$’000 US$’000 US$’000 US$’000 US$’000
At April 1, 2011 31,941 1,377,529 56,474 1,003 (76,110) 63,280 (18,583) (1,523) 58,236 342,474 179 – 1,834,900
Profit for the year – – – – – ––––472,992 2,424 – 475,416
Other comprehensive
(loss)/income – – (36,337) – – – 33,890 (46,725) – (34,454) (4,611) – (88,237)
Total comprehensive
(loss)/income for
the year – – (36,337) – – – 33,890 (46,725) – 438,538 (2,187) – 387,179
Consideration for
acquisition of
a subsidiary – – – – – – – – 36,555 – – – 36,555
Acquisition of
subsidiaries – – – – – –––––88,742 – 88,742
Transfer to statutory
reserve – – – – – – – – 6,057 (6,057) – – –
Issue of ordinary
shares 1,088 196,206 – – – ––––– – –197,294
Exercise of share
options 102 10,787 – – – ––––– – –10,889
Vesting of shares
under long-term
incentive program – – – – 48,252 (76,620) – – – – – – (28,368)
Share-based
compensation – – – – – 66,418 – – – – – – 66,418
Dividends paid – – – – – ––––(114,687) – – (114,687)
Guaranteed dividend
(Note 29) – – – – – ––––(30,953) – – (30,953)
At March 31, 2012 33,131 1,584,522 20,137 1,003 (27,858) 53,078 15,307 (48,248) 100,848 629,315 86,734 – 2,447,969
At April 1, 2012 33,131 1,584,522 20,137 1,003 (27,858) 53,078 15,307 (48,248) 100,848 629,315 86,734 – 2,447,969
Profit for the year –– – –– ––––635,148 (3,556) – 631,592
Other comprehensive
(loss)/income – – (4,057) – – – 19,772 (118,602) – (18,806) – – (121,693)
Total comprehensive
(loss)/income for
the year – – (4,057) – – – 19,772 (118,602) – 616,342 (3,556) – 509,899
Contribution from
non-controlling
interest (Note 38) –– – –– –––––147,700 – 147,700
Put option written on
non-controlling interest
(Note 29(iii)) –– – –– ––––– –(212,900) (212,900)
Transfer to statutory
reserve – – – – – – – – 164 (164) – – –
Issue of ordinary shares
(Note 30) 452 108,070 – – – – – – (36,555) – – – 71,967
Exercise of share options 67 6,336 – – – ––––– – –6,403
Repurchase of shares (185) (44,122) – 185 – ––––– – –(44,122)
Vesting of shares
under long-term
incentive program – – – – 96,941 (133,951) – – – – – – (37,010)
Share-based
compensation – – – – – 77,724 – – – – – – 77,724
Contribution to employee
share trusts – – – – (91,280) ––––– – –(91,280)
Dividends paid –– – –– ––––(191,729) (2,947) – (194,676)
Increase in ownership
interest in a subsidiary –– – –– –––––(1,493) – (1,493)
At March 31, 2013 33,465 1,654,806 16,080 1,188 (22,197) (3,149) 35,079 (166,850) 64,457 1,053,764 226,438 (212,900) 2,680,181