Lenovo 2013 Annual Report Download - page 145
Download and view the complete annual report
Please find page 145 of the 2013 Lenovo annual report below. You can navigate through the pages in the report by either clicking on the pages listed below, or by using the keyword search tool below to find specific information within the annual report.-
 1
1 -
2
-
3
-
4
-
5
-
6
-
7
-
8
-
9
-
10
-
11
-
12
-
13
-
14
-
15
-
16
-
17
-
18
-
19
-
20
-
21
-
22
-
23
-
24
-
25
-
26
-
27
-
28
-
29
-
30
-
31
-
32
-
33
-
34
-
35
-
36
-
37
-
38
-
39
-
40
-
41
-
42
-
43
-
44
-
45
-
46
-
47
-
48
-
49
-
50
-
51
-
52
-
53
-
54
-
55
-
56
-
57
-
58
-
59
-
60
-
61
-
62
-
63
-
64
-
65
-
66
-
67
-
68
-
69
-
70
-
71
-
72
-
73
-
74
-
75
-
76
-
77
-
78
-
79
-
80
-
81
-
82
-
83
-
84
-
85
-
86
-
87
-
88
-
89
-
90
-
91
-
92
-
93
-
94
-
95
-
96
-
97
-
98
-
99
-
100
-
101
-
102
-
103
-
104
-
105
-
106
-
107
-
108
-
109
-
110
-
111
-
112
-
113
-
114
-
115
-
116
-
117
-
118
-
119
-
120
-
121
-
122
-
123
-
124
-
125
-
126
-
127
-
128
-
129
-
130
-
131
-
132
-
133
-
134
-
 135
135 -
 136
136 -
 137
137 -
 138
138 -
 139
139 -
 140
140 -
 141
141 -
 142
142 -
 143
143 -
 144
144 -
 145
145 -
 146
146 -
 147
147 -
 148
148 -
 149
149 -
 150
150 -
 151
151 -
 152
152 -
 153
153 -
 154
154 -
 155
155 -
156
-
157
-
158
-
159
-
160
-
161
-
162
-
163
-
164
-
165
-
166
-
167
-
168
-
169
-
170
-
171
-
172
-
173
-
174
-
175
-
176
-
177
-
178
-
179
-
180
-
181
-
182
-
183
-
184
-
185
-
186
-
187
-
188
 |
 |
2012/13 Annual Report Lenovo Group Limited 143
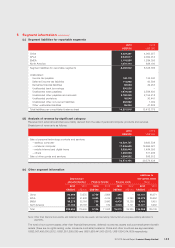
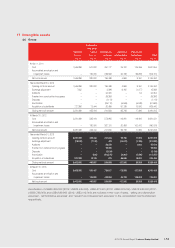
5 Segment information (continued)
(c) Segment liabilities for reportable segments
2013 2012
US$’000 US$’000
China 4,324,261 4,063,257
APLA 2,043,017 2,092,914
EMEA 1,115,554 1,284,035
North America 1,001,110 888,180
Segment liabilities for reportable segments 8,483,942 8,328,386
Unallocated:
Income tax payable 100,179 135,530
Deferred income tax liabilities 113,992 83,594
Derivative financial liabilities 69,053 49,253
Unallocated bank borrowings 300,000 –
Unallocated trade payables 1,979,026 2,588,493
Unallocated other payables and accruals 2,750,353 2,154,218
Unallocated provisions 35,045 30,441
Unallocated other non-current liabilities 284,982 1,032
Other unallocated liabilities 85,244 41,832
Total liabilities per consolidated balance sheet 14,201,816 13,412,779
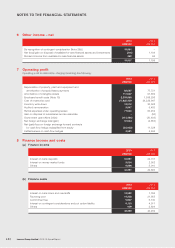
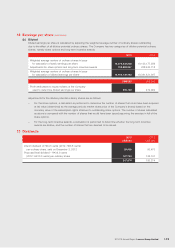
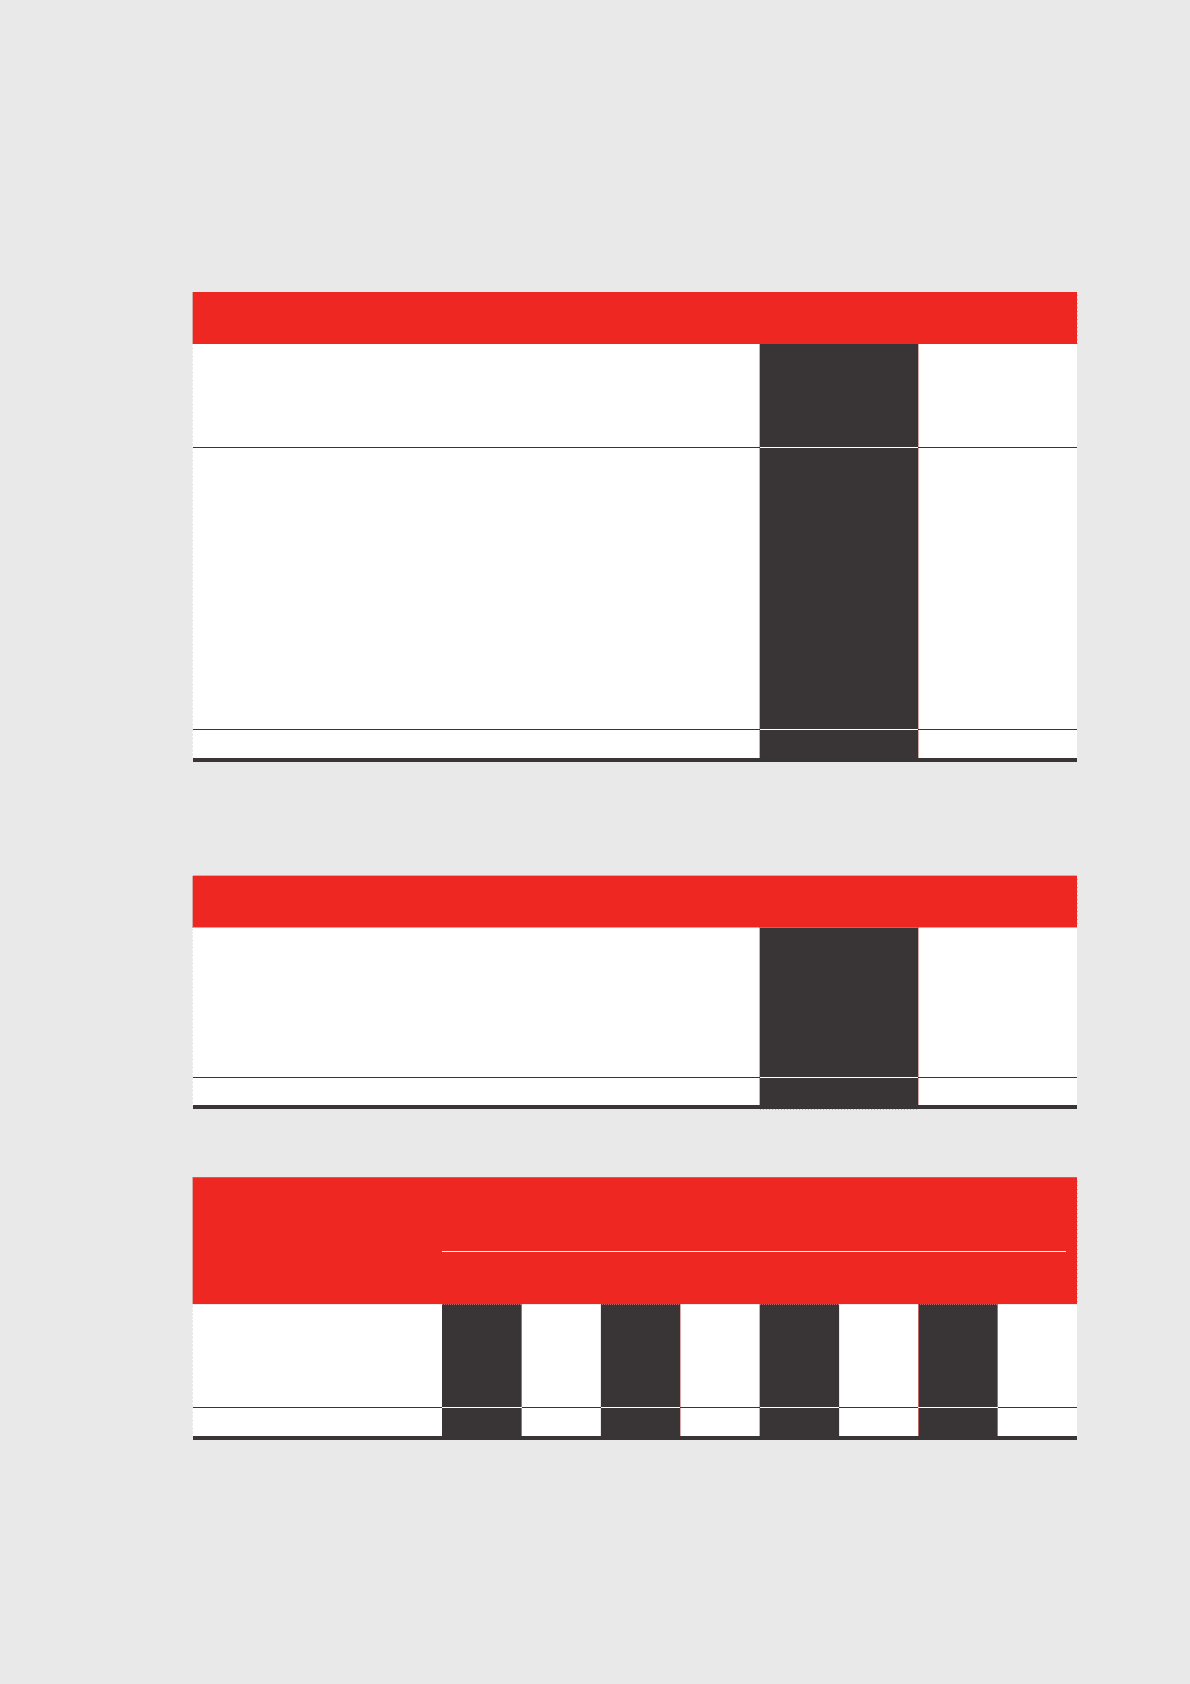
(d) Analysis of revenue by significant category
Revenue from external customers are mainly derived from the sale of personal computer products and services.
Breakdown of revenue is as follows:
2013 2012
US$’000 US$’000
Sale of personal technology products and services
– desktop computer 10,524,707 9,883,538
– notebook computer 17,935,693 16,696,527
– mobile internet and digital home 3,039,443 1,484,395
– others 1,288,666 611,466
Sale of other goods and services 1,084,892 898,512
33,873,401 29,574,438
(e) Other segment information
Depreciation
and amortization Finance income Finance costs
Additions to
non-current assets
(Note)
2013 2012 2013 2012 2013 2012 2013 2012
US$’000 US$’000 US$’000 US$’000 US$’000 US$’000 US$’000 US$’000
China
93,999
73,575
2,738
2,988
344
–
63,131
86,071
APLA
48,141
41,508
4,623
4,415
4,944
6,250
39,579
25,652
EMEA
36,278
32,164
709
3,496
6,476
15,235
9,181
6,451
North America
31,186
28,158
36
169
3,546
3,741
15,107
6,962
Total
209,604
175,405
8,106
11,068
15,310
25,226
126,998
125,136
Note: Other than financial instruments and deferred income tax assets; and excluding construction-in-progress pending allocation to
segments.
The total of non-current assets other than financial instruments, deferred income tax assets and post-employment benefit
assets (there are no rights arising under insurance contracts) located in China and other countries are approximately
US$2,067,456,000 (2012: US$1,801,595,000) and US$1,988,441,000 (2012: US$1,834,314,000) respectively.