Lenovo 2013 Annual Report Download - page 140
Download and view the complete annual report
Please find page 140 of the 2013 Lenovo annual report below. You can navigate through the pages in the report by either clicking on the pages listed below, or by using the keyword search tool below to find specific information within the annual report.-
 1
1 -
2
-
3
-
4
-
5
-
6
-
7
-
8
-
9
-
10
-
11
-
12
-
13
-
14
-
15
-
16
-
17
-
18
-
19
-
20
-
21
-
22
-
23
-
24
-
25
-
26
-
27
-
28
-
29
-
30
-
31
-
32
-
33
-
34
-
35
-
36
-
37
-
38
-
39
-
40
-
41
-
42
-
43
-
44
-
45
-
46
-
47
-
48
-
49
-
50
-
51
-
52
-
53
-
54
-
55
-
56
-
57
-
58
-
59
-
60
-
61
-
62
-
63
-
64
-
65
-
66
-
67
-
68
-
69
-
70
-
71
-
72
-
73
-
74
-
75
-
76
-
77
-
78
-
79
-
80
-
81
-
82
-
83
-
84
-
85
-
86
-
87
-
88
-
89
-
90
-
91
-
92
-
93
-
94
-
95
-
96
-
97
-
98
-
99
-
100
-
101
-
102
-
103
-
104
-
105
-
106
-
107
-
108
-
109
-
110
-
111
-
112
-
113
-
114
-
115
-
116
-
117
-
118
-
119
-
120
-
121
-
122
-
123
-
124
-
125
-
126
-
127
-
128
-
129
-
 130
130 -
 131
131 -
 132
132 -
 133
133 -
 134
134 -
 135
135 -
 136
136 -
 137
137 -
 138
138 -
 139
139 -
 140
140 -
 141
141 -
 142
142 -
 143
143 -
 144
144 -
 145
145 -
 146
146 -
 147
147 -
 148
148 -
 149
149 -
 150
150 -
151
-
152
-
153
-
154
-
155
-
156
-
157
-
158
-
159
-
160
-
161
-
162
-
163
-
164
-
165
-
166
-
167
-
168
-
169
-
170
-
171
-
172
-
173
-
174
-
175
-
176
-
177
-
178
-
179
-
180
-
181
-
182
-
183
-
184
-
185
-
186
-
187
-
188
 |
 |
NOTES TO THE FINANCIAL STATEMENTS
Lenovo Group Limited 2012/13 Annual Report
138
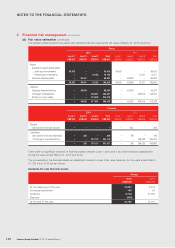
3 Financial risk management (continued)
(d) Fair value estimation (continued)
The following table presents the assets and liabilities that are measured at fair value at March 31, 2013 and 2012.
Group
2013 2012
Level 1 Level 2 Level 3 Total Level 1 Level 2 Level 3 Total
US$’000 US$’000 US$’000 US$’000 US$’000 US$’000 US$’000 US$’000
Assets
Available-for-sale financial assets
Listed equity investments 53,800 – – 53,800 59,625 – – 59,625
Unlisted equity investments – – 16,162 16,162 – – 12,321 12,321
Derivative financial assets – 99,491 – 99,491 – 62,883 – 62,883
53,800 99,491 16,162 169,453 59,625 62,883 12,321 134,829
Liabilities
Derivative financial liabilities – 69,053 – 69,053 – 49,253 – 49,253
Contingent considerations – – 302,367 302,367 – – 428,915 428,915
Written put option liability – – 215,018 215,018 ––––
– 69,053 517,385 586,438 – 49,253 428,915 478,168
Company
2013 2012
Level 1 Level 2 Level 3 Total Level 1 Level 2 Level 3 Total
US$’000 US$’000 US$’000 US$’000 US$’000 US$’000 US$’000 US$’000
Assets
Derivative financial assets
––––– 953 – 953
Liabilities
Derivative financial liabilities
– 238 – 238 – 796 – 796
Contingent considerations
– – 301,113 301,113 – – 256,093 256,093
– 238 301,113 301,351 – 796 256,093 256,889
There were no significant transfers of financial assets between Level 1 and Level 2 fair value hierarchy classification
during the years ended March 31, 2013 and 2012.
The movements in the financial assets and liabilities included in Level 3 fair value hierarchy for the years ended March
31, 2013 and 2012 are as follows:
Available-for-sale financial assets
Group
2013 2012
US$’000 US$’000
At the beginning of the year 12,321 2,216
Exchange adjustment 140 50
Additions 4,104 10,055
Disposal (403) –
At the end of the year 16,162 12,321