Lenovo 2013 Annual Report Download - page 137
Download and view the complete annual report
Please find page 137 of the 2013 Lenovo annual report below. You can navigate through the pages in the report by either clicking on the pages listed below, or by using the keyword search tool below to find specific information within the annual report.-
 1
1 -
2
-
3
-
4
-
5
-
6
-
7
-
8
-
9
-
10
-
11
-
12
-
13
-
14
-
15
-
16
-
17
-
18
-
19
-
20
-
21
-
22
-
23
-
24
-
25
-
26
-
27
-
28
-
29
-
30
-
31
-
32
-
33
-
34
-
35
-
36
-
37
-
38
-
39
-
40
-
41
-
42
-
43
-
44
-
45
-
46
-
47
-
48
-
49
-
50
-
51
-
52
-
53
-
54
-
55
-
56
-
57
-
58
-
59
-
60
-
61
-
62
-
63
-
64
-
65
-
66
-
67
-
68
-
69
-
70
-
71
-
72
-
73
-
74
-
75
-
76
-
77
-
78
-
79
-
80
-
81
-
82
-
83
-
84
-
85
-
86
-
87
-
88
-
89
-
90
-
91
-
92
-
93
-
94
-
95
-
96
-
97
-
98
-
99
-
100
-
101
-
102
-
103
-
104
-
105
-
106
-
107
-
108
-
109
-
110
-
111
-
112
-
113
-
114
-
115
-
116
-
117
-
118
-
119
-
120
-
121
-
122
-
123
-
124
-
125
-
126
-
 127
127 -
 128
128 -
 129
129 -
 130
130 -
 131
131 -
 132
132 -
 133
133 -
 134
134 -
 135
135 -
 136
136 -
 137
137 -
 138
138 -
 139
139 -
 140
140 -
 141
141 -
 142
142 -
 143
143 -
 144
144 -
 145
145 -
 146
146 -
 147
147 -
148
-
149
-
150
-
151
-
152
-
153
-
154
-
155
-
156
-
157
-
158
-
159
-
160
-
161
-
162
-
163
-
164
-
165
-
166
-
167
-
168
-
169
-
170
-
171
-
172
-
173
-
174
-
175
-
176
-
177
-
178
-
179
-
180
-
181
-
182
-
183
-
184
-
185
-
186
-
187
-
188
 |
 |

2012/13 Annual Report Lenovo Group Limited 135
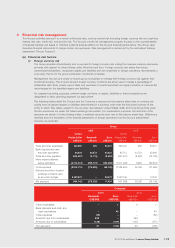
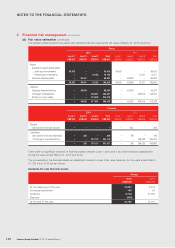
3 Financial risk management (continued)
(a) Financial risk factors (continued)
(iv) Liquidity risk (continued)
Group
Repayable
on demand
or 3 months
or less
Over
3 months
to 1 year
Over 1 to
3 years
Over 3 to
5 years Total
US$’000 US$’000 US$’000 US$’000 US$’000
At March 31, 2013
Bank loans 22,192 153,646 303,133 – 478,971
Trade, notes and other payables
and accruals 7,636,708 1,115,520 – – 8,752,228
Contingent considerations – – 42,000 276,251 318,251
Deferred consideration – – – 2,172 2,172
Guaranteed dividend to
non-controlling shareholders
of a subsidiary – 6,347 12,695 11,637 30,679
Written put option liability – – – 224,790 224,790
Others – – 139,733 163,570 303,303
Derivatives settled in gross:
Forward foreign exchange
contracts
– outflow 4,213,699 22,098 – – 4,235,797
– inflow (4,241,612) (221,081) – – (4,462,693)
At March 31, 2012
Bank loans 58,499 4,453 – – 62,952
Trade, notes and other payables
and accruals 7,856,295 916,516 – – 8,772,811
Contingent considerations – – 179,527 275,000 454,527
Guaranteed dividend to
non-controlling shareholders
of a subsidiary – – 13,202 18,703 31,905
Others – – 93,038 89,018 182,056
Derivatives settled in net:
Forward foreign exchange
contracts – 116 – – 116
Derivatives settled in gross:
Forward foreign exchange
contracts
– outflow 2,689,443 240,230 – – 2,929,673
– inflow (2,693,660) (249,404) – – (2,943,064)