Lenovo 2013 Annual Report Download - page 179
Download and view the complete annual report
Please find page 179 of the 2013 Lenovo annual report below. You can navigate through the pages in the report by either clicking on the pages listed below, or by using the keyword search tool below to find specific information within the annual report.-
 1
1 -
2
-
3
-
4
-
5
-
6
-
7
-
8
-
9
-
10
-
11
-
12
-
13
-
14
-
15
-
16
-
17
-
18
-
19
-
20
-
21
-
22
-
23
-
24
-
25
-
26
-
27
-
28
-
29
-
30
-
31
-
32
-
33
-
34
-
35
-
36
-
37
-
38
-
39
-
40
-
41
-
42
-
43
-
44
-
45
-
46
-
47
-
48
-
49
-
50
-
51
-
52
-
53
-
54
-
55
-
56
-
57
-
58
-
59
-
60
-
61
-
62
-
63
-
64
-
65
-
66
-
67
-
68
-
69
-
70
-
71
-
72
-
73
-
74
-
75
-
76
-
77
-
78
-
79
-
80
-
81
-
82
-
83
-
84
-
85
-
86
-
87
-
88
-
89
-
90
-
91
-
92
-
93
-
94
-
95
-
96
-
97
-
98
-
99
-
100
-
101
-
102
-
103
-
104
-
105
-
106
-
107
-
108
-
109
-
110
-
111
-
112
-
113
-
114
-
115
-
116
-
117
-
118
-
119
-
120
-
121
-
122
-
123
-
124
-
125
-
126
-
127
-
128
-
129
-
130
-
131
-
132
-
133
-
134
-
135
-
136
-
137
-
138
-
139
-
140
-
141
-
142
-
143
-
144
-
145
-
146
-
147
-
148
-
149
-
150
-
151
-
152
-
153
-
154
-
155
-
156
-
157
-
158
-
159
-
160
-
161
-
162
-
163
-
164
-
165
-
166
-
167
-
168
-
 169
169 -
 170
170 -
 171
171 -
 172
172 -
 173
173 -
 174
174 -
 175
175 -
 176
176 -
 177
177 -
 178
178 -
 179
179 -
 180
180 -
 181
181 -
 182
182 -
 183
183 -
 184
184 -
 185
185 -
 186
186 -
 187
187 -
 188
188
 |
 |

2012/13 Annual Report Lenovo Group Limited 177
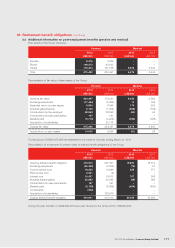
36 Retirement benefit obligations (continued)
(c) Additional information on post-employment benefits (pension and medical)
Plan assets of the Group comprise:
Pension Medical
2013 2012 2013 2012
US$’000 US$’000 US$’000 US$’000
Equities 8,276 3,256 ––
Bonds 148,873 83,503 ––
Others 118,273 137,738 5,878 6,445
Total 275,422 224,497 5,878 6,445
Reconciliation of fair value of plan assets of the Group:
Pension Medical
2013 2012 2013 2012
US$’000 US$’000 US$’000 US$’000
Opening fair value 224,497 174,241 6,445 6,562
Exchange adjustment (17,494) (2,846) 10 169
Expected return on plan assets 5,904 6,548 174 202
Actuarial gains/(losses) 8,105 (1,622) (265) (164)
Contributions by the employer 59,953 28,093 (90) 44
Contributions by plan participants 167 191 ––
Benefits paid (5,710) (5,226) (396) (368)
Acquisition of subsidiaries –25,118 ––
Closing fair value 275,422 224,497 5,878 6,445
Actual return on plan assets 14,009 4,926 (91) 38
Contributions of US$18,075,809 are estimated to be made for the year ending March 31, 2014.
Reconciliation of movements in present value of defined benefit obligations of the Group:
Pension Medical
2013 2012 2013 2012
US$’000 US$’000 US$’000 US$’000
Opening defined benefit obligation 415,910 237,361 19,850 18,312
Exchange adjustment (36,259) (3,236) (79) 57
Current service cost 16,233 14,296 522 577
Past service cost 2,031 (9) ––
Interest cost 10,407 10,611 707 958
Actuarial losses/(gains) 25,063 35,385 (49) 366
Contributions by plan participants 167 191 ––
Benefits paid (8,709) (5,665) (409) (420)
Curtailments (202) –––
Acquisition of subsidiaries –126,976 ––
Closing defined benefit obligation 424,641 415,910 20,542 19,850
During the year, benefits of US$2,999,000 were paid directly by the Group (2012: US$439,000).