Lenovo 2013 Annual Report Download - page 167
Download and view the complete annual report
Please find page 167 of the 2013 Lenovo annual report below. You can navigate through the pages in the report by either clicking on the pages listed below, or by using the keyword search tool below to find specific information within the annual report.-
 1
1 -
2
-
3
-
4
-
5
-
6
-
7
-
8
-
9
-
10
-
11
-
12
-
13
-
14
-
15
-
16
-
17
-
18
-
19
-
20
-
21
-
22
-
23
-
24
-
25
-
26
-
27
-
28
-
29
-
30
-
31
-
32
-
33
-
34
-
35
-
36
-
37
-
38
-
39
-
40
-
41
-
42
-
43
-
44
-
45
-
46
-
47
-
48
-
49
-
50
-
51
-
52
-
53
-
54
-
55
-
56
-
57
-
58
-
59
-
60
-
61
-
62
-
63
-
64
-
65
-
66
-
67
-
68
-
69
-
70
-
71
-
72
-
73
-
74
-
75
-
76
-
77
-
78
-
79
-
80
-
81
-
82
-
83
-
84
-
85
-
86
-
87
-
88
-
89
-
90
-
91
-
92
-
93
-
94
-
95
-
96
-
97
-
98
-
99
-
100
-
101
-
102
-
103
-
104
-
105
-
106
-
107
-
108
-
109
-
110
-
111
-
112
-
113
-
114
-
115
-
116
-
117
-
118
-
119
-
120
-
121
-
122
-
123
-
124
-
125
-
126
-
127
-
128
-
129
-
130
-
131
-
132
-
133
-
134
-
135
-
136
-
137
-
138
-
139
-
140
-
141
-
142
-
143
-
144
-
145
-
146
-
147
-
148
-
149
-
150
-
151
-
152
-
153
-
154
-
155
-
156
-
 157
157 -
 158
158 -
 159
159 -
 160
160 -
 161
161 -
 162
162 -
 163
163 -
 164
164 -
 165
165 -
 166
166 -
 167
167 -
 168
168 -
 169
169 -
 170
170 -
 171
171 -
 172
172 -
 173
173 -
 174
174 -
 175
175 -
 176
176 -
 177
177 -
178
-
179
-
180
-
181
-
182
-
183
-
184
-
185
-
186
-
187
-
188
 |
 |

2012/13 Annual Report Lenovo Group Limited 165
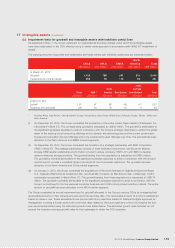
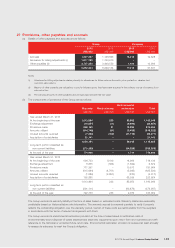
27 Provisions, other payables and accruals
(a) Details of other payables and accruals are as follows:
Group Company
2013 2012 2013 2012
US$’000 US$’000 US$’000 US$’000
Accruals 1,327,327 1,146,665 16,015 19,628
Allowance for billing adjustments (i) 1,817,782 1,753,910 ––
Other payables (ii) 3,707,235 3,448,559 1,400 12,009
6,852,344 6,349,134 17,415 31,637
Notes:
(i) Allowance for billing adjustments relates primarily to allowances for future volume discounts, price protection, rebates, and
customer sales returns.
(ii) Majority of other payables are obligations to pay for finished goods that have been acquired in the ordinary course of business from
subcontractors.
(iii) The carrying amounts of other payables and accruals approximate their fair value.
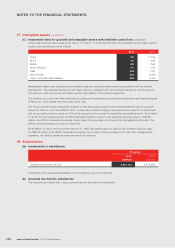
(b) The components of provisions of the Group are as follows:
Warranty Restructuring
Environmental
restoration Total
US$’000 US$’000 US$’000 US$’000
Year ended March 31, 2013
At the beginning of the year 1,013,864 233 85,952 1,100,049
Exchange adjustment (16,851) (11) (6,992) (23,854)
Provisions made 858,165 31 12,294 870,490
Amounts utilized (814,748) (91) (3,493) (818,332)
Unused amounts reversed (7,390) (162) (31,719) (39,271)
Acquisition of subsidiaries 21,141 – – 21,141
1,054,181 – 56,042 1,110,223
Long-term portion classified as
non-current liabilities (279,255) – (54,328) (333,583)
At the end of the year 774,926 – 1,714 776,640
Year ended March 31, 2012
At the beginning of the year 694,723 8,419 14,994 718,136
Exchange adjustment 8,835 (564) (1,699) 6,572
Provisions made 771,391 – 10,573 781,964
Amounts utilized (615,684) (4,761) (5,085) (625,530)
Unused amounts reversed (1,286) (2,861) (870) (5,017)
Acquisition of subsidiaries 155,885 – 68,039 223,924
1,013,864 233 85,952 1,100,049
Long-term portion classified as
non-current liabilities (291,111) – (83,876) (374,987)
At the end of the year 722,753 233 2,076 725,062
The Group records its warranty liability at the time of sales based on estimated costs. Warranty claims are reasonably
predictable based on historical failure rate information. The warranty accrual is reviewed quarterly to verify it properly
reflects the outstanding obligation over the warranty period. Certain of these costs are reimbursable from the suppliers
in accordance with the terms of relevant arrangement with them.
The Group records its environmental restoration provision at the time of sales based on estimated costs of
environmentally-sound disposal of waste electrical and electronic equipments upon return from end-customers and with
reference to the historical or projected future return rate. Environmental restoration provision is reviewed at least annually
to assess its adequacy to meet the Group’s obligation.