Lenovo 2013 Annual Report Download - page 152
Download and view the complete annual report
Please find page 152 of the 2013 Lenovo annual report below. You can navigate through the pages in the report by either clicking on the pages listed below, or by using the keyword search tool below to find specific information within the annual report.-
 1
1 -
2
-
3
-
4
-
5
-
6
-
7
-
8
-
9
-
10
-
11
-
12
-
13
-
14
-
15
-
16
-
17
-
18
-
19
-
20
-
21
-
22
-
23
-
24
-
25
-
26
-
27
-
28
-
29
-
30
-
31
-
32
-
33
-
34
-
35
-
36
-
37
-
38
-
39
-
40
-
41
-
42
-
43
-
44
-
45
-
46
-
47
-
48
-
49
-
50
-
51
-
52
-
53
-
54
-
55
-
56
-
57
-
58
-
59
-
60
-
61
-
62
-
63
-
64
-
65
-
66
-
67
-
68
-
69
-
70
-
71
-
72
-
73
-
74
-
75
-
76
-
77
-
78
-
79
-
80
-
81
-
82
-
83
-
84
-
85
-
86
-
87
-
88
-
89
-
90
-
91
-
92
-
93
-
94
-
95
-
96
-
97
-
98
-
99
-
100
-
101
-
102
-
103
-
104
-
105
-
106
-
107
-
108
-
109
-
110
-
111
-
112
-
113
-
114
-
115
-
116
-
117
-
118
-
119
-
120
-
121
-
122
-
123
-
124
-
125
-
126
-
127
-
128
-
129
-
130
-
131
-
132
-
133
-
134
-
135
-
136
-
137
-
138
-
139
-
140
-
141
-
 142
142 -
 143
143 -
 144
144 -
 145
145 -
 146
146 -
 147
147 -
 148
148 -
 149
149 -
 150
150 -
 151
151 -
 152
152 -
 153
153 -
 154
154 -
 155
155 -
 156
156 -
 157
157 -
 158
158 -
 159
159 -
 160
160 -
 161
161 -
 162
162 -
163
-
164
-
165
-
166
-
167
-
168
-
169
-
170
-
171
-
172
-
173
-
174
-
175
-
176
-
177
-
178
-
179
-
180
-
181
-
182
-
183
-
184
-
185
-
186
-
187
-
188
 |
 |
NOTES TO THE FINANCIAL STATEMENTS
Lenovo Group Limited 2012/13 Annual Report
150
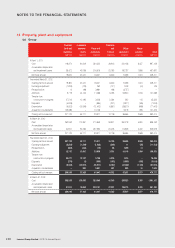
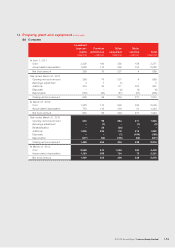
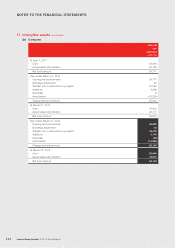
14 Property, plant and equipment
(a) Group
Freehold
land and
buildings
Leasehold
improve-
ments
Plant and
machinery
Furniture
and
fixtures
Office
equipment
Motor
vehicles Total
US$’000 US$’000 US$’000 US$’000 US$’000 US$’000 US$’000
At April 1, 2011
Cost 118,374 81,009 234,522 28,613 231,133 3,457 697,108
Accumulated depreciation
and impairment losses 38,572 49,768 216,515 20,183 160,797 1,856 487,691
Net book amount 79,802 31,241 18,007 8,430 70,336 1,601 209,417
Year ended March 31, 2012
Opening net book amount 79,802 31,241 18,007 8,430 70,336 1,601 209,417
Exchange adjustment (1,233) (122) 252 (107) 1,403 (44) 149
Reclassification 6 (98) 3,681 168 (3,757) – –
Additions 5,719 24,143 11,288 5,033 53,540 1,515 101,238
Transfer from
construction-in-progress 27,213 12,196 3,223 2,234 542 115 45,523
Disposals (4,249) – (884) (201) (2,317) (165) (7,816)
Depreciation (5,522) (15,249) (12,402) (4,851) (38,570) (848) (77,442)
Acquisition of subsidiaries 105,386 – 10,146 – 5,478 395 121,405
Closing net book amount 207,122 52,111 33,311 10,706 86,655 2,569 392,474
At March 31, 2012
Cost 252,063 112,267 270,643 34,911 261,278 4,991 936,153
Accumulated depreciation
and impairment losses 44,941 60,156 237,332 24,205 174,623 2,422 543,679
Net book amount 207,122 52,111 33,311 10,706 86,655 2,569 392,474
Year ended March 31, 2013
Opening net book amount 207,122 52,111 33,311 10,706 86,655 2,569 392,474
Exchange adjustment (8,232) (1,599) (1,028) (248) 11 (56) (11,152)
Reclassification (888) (444) (15) 68 1,265 14 –
Additions 12,147 13,847 33,936 3,301 41,116 1,984 106,331
Transfer from
construction-in-progress 55,271 13,157 5,708 4,278 1,014 – 79,428
Disposals (776) (3) (585) (152) (1,665) (438) (3,619)
Depreciation (8,548) (20,501) (15,511) (4,182) (41,482) (1,106) (91,330)
Acquisition of subsidiaries – 860 5,631 251 893 10 7,645
Closing net book amount 256,096 57,428 61,447 14,022 87,807 2,977 479,777
At March 31, 2013
Cost 308,006 136,080 283,548 41,243 286,520 5,760 1,061,157
Accumulated depreciation
and impairment losses 51,910 78,652 222,101 27,221 198,713 2,783 581,380
Net book amount 256,096 57,428 61,447 14,022 87,807 2,977 479,777