Lenovo 2013 Annual Report Download - page 135
Download and view the complete annual report
Please find page 135 of the 2013 Lenovo annual report below. You can navigate through the pages in the report by either clicking on the pages listed below, or by using the keyword search tool below to find specific information within the annual report.-
 1
1 -
2
-
3
-
4
-
5
-
6
-
7
-
8
-
9
-
10
-
11
-
12
-
13
-
14
-
15
-
16
-
17
-
18
-
19
-
20
-
21
-
22
-
23
-
24
-
25
-
26
-
27
-
28
-
29
-
30
-
31
-
32
-
33
-
34
-
35
-
36
-
37
-
38
-
39
-
40
-
41
-
42
-
43
-
44
-
45
-
46
-
47
-
48
-
49
-
50
-
51
-
52
-
53
-
54
-
55
-
56
-
57
-
58
-
59
-
60
-
61
-
62
-
63
-
64
-
65
-
66
-
67
-
68
-
69
-
70
-
71
-
72
-
73
-
74
-
75
-
76
-
77
-
78
-
79
-
80
-
81
-
82
-
83
-
84
-
85
-
86
-
87
-
88
-
89
-
90
-
91
-
92
-
93
-
94
-
95
-
96
-
97
-
98
-
99
-
100
-
101
-
102
-
103
-
104
-
105
-
106
-
107
-
108
-
109
-
110
-
111
-
112
-
113
-
114
-
115
-
116
-
117
-
118
-
119
-
120
-
121
-
122
-
123
-
124
-
 125
125 -
 126
126 -
 127
127 -
 128
128 -
 129
129 -
 130
130 -
 131
131 -
 132
132 -
 133
133 -
 134
134 -
 135
135 -
 136
136 -
 137
137 -
 138
138 -
 139
139 -
 140
140 -
 141
141 -
 142
142 -
 143
143 -
 144
144 -
 145
145 -
146
-
147
-
148
-
149
-
150
-
151
-
152
-
153
-
154
-
155
-
156
-
157
-
158
-
159
-
160
-
161
-
162
-
163
-
164
-
165
-
166
-
167
-
168
-
169
-
170
-
171
-
172
-
173
-
174
-
175
-
176
-
177
-
178
-
179
-
180
-
181
-
182
-
183
-
184
-
185
-
186
-
187
-
188
 |
 |

2012/13 Annual Report Lenovo Group Limited 133
3 Financial risk management
The Group’s activities expose it to a variety of financial risks, such as market risk (including foreign currency risk and cash flow
interest rate risk), credit risk, and liquidity risk. The Group’s overall risk management program focuses on the unpredictability
of financial markets and seeks to minimize potential adverse effects on the Group’s financial performance. The Group uses
derivative financial instruments to hedge certain risk exposures. Risk management is carried out by the centralized treasury
department (“Group Treasury”).
(a) Financial risk factors
(i) Foreign currency risk
The Group operates internationally and is exposed to foreign currency risk arising from various currency exposures,
primarily with respect to United States dollar, Renminbi and Euro. Foreign currency risk arises from future
commercial transactions, recognized assets and liabilities and net investment in foreign operations denominated in
a currency that is not the group companies’ functional currencies.
Management has set up a policy to require group companies to manage their foreign currency risk against their
functional currency. The Group’s forward foreign currency contracts are either used to hedge a percentage of
anticipated cash flows (mainly export sales and purchase of inventories) which are highly probable, or used as fair
value hedges for the identified assets and liabilities.
For segment reporting purposes, external hedge contracts on assets, liabilities or future transactions are
designated to each operating segment, as appropriate.
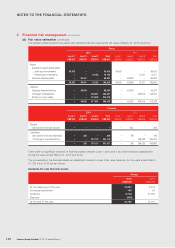
The following tables detail the Group’s and the Company’s exposure at the balance sheet date to currency risk
arising from recognized assets or liabilities denominated in a currency other than the functional currency of the
entity to which they relate, except for the currency risk between United States dollar and Hong Kong dollar given
the two currencies are under the linked exchange rate system. For presentation purposes, the amounts of the
exposure are shown in United States dollars, translated using the spot rate at the balance sheet date. Differences
resulting from the translation of the financial statements of foreign operations into the Group’s presentation
currency are excluded.
Group
2013 2012
United
States dollar Renminbi Euro
United
States dollar Renminbi Euro
US$’000 US$’000 US$’000 US$’000 US$’000 US$’000
Trade and other receivables 233,980 396 80,431 326,440 960 53,210
Bank deposits and cash
and cash equivalents 24,609 38,273 33,421 82,712 34,754 22,692
Trade and other payables (600,487) (4,176) (3,552) (627,547) (6,487) (32,763)
Intercompany balances
before elimination (2,173,214) (309,721) (193,468) (1,971,439) 6,969 (80,501)
Gross exposure (2,515,112) (275,228) (83,168) (2,189,834) 36,196 (37,362)
Notional amounts of forward
exchange contracts used
as economic hedges 2,020,972 – 94,572 2,032,745 – 13,203
Net exposure (494,140) (275,228) 11,404 (157,089) 36,196 (24,159)
Company
2013 2012
Renminbi Euro Renminbi Euro
US$’000 US$’000 US$’000 US$’000
Other receivables –121
Bank deposits and cash and
cash equivalents –40 –43
Other payables (16) – – (63)
Amounts due from subsidiaries 222 – 190 –
Amounts due to subsidiaries (139) (164) (137) (171)
Net exposure 67 (123) 55 (190)