Lenovo 2013 Annual Report Download - page 148
Download and view the complete annual report
Please find page 148 of the 2013 Lenovo annual report below. You can navigate through the pages in the report by either clicking on the pages listed below, or by using the keyword search tool below to find specific information within the annual report.-
 1
1 -
2
-
3
-
4
-
5
-
6
-
7
-
8
-
9
-
10
-
11
-
12
-
13
-
14
-
15
-
16
-
17
-
18
-
19
-
20
-
21
-
22
-
23
-
24
-
25
-
26
-
27
-
28
-
29
-
30
-
31
-
32
-
33
-
34
-
35
-
36
-
37
-
38
-
39
-
40
-
41
-
42
-
43
-
44
-
45
-
46
-
47
-
48
-
49
-
50
-
51
-
52
-
53
-
54
-
55
-
56
-
57
-
58
-
59
-
60
-
61
-
62
-
63
-
64
-
65
-
66
-
67
-
68
-
69
-
70
-
71
-
72
-
73
-
74
-
75
-
76
-
77
-
78
-
79
-
80
-
81
-
82
-
83
-
84
-
85
-
86
-
87
-
88
-
89
-
90
-
91
-
92
-
93
-
94
-
95
-
96
-
97
-
98
-
99
-
100
-
101
-
102
-
103
-
104
-
105
-
106
-
107
-
108
-
109
-
110
-
111
-
112
-
113
-
114
-
115
-
116
-
117
-
118
-
119
-
120
-
121
-
122
-
123
-
124
-
125
-
126
-
127
-
128
-
129
-
130
-
131
-
132
-
133
-
134
-
135
-
136
-
137
-
 138
138 -
 139
139 -
 140
140 -
 141
141 -
 142
142 -
 143
143 -
 144
144 -
 145
145 -
 146
146 -
 147
147 -
 148
148 -
 149
149 -
 150
150 -
 151
151 -
 152
152 -
 153
153 -
 154
154 -
 155
155 -
 156
156 -
 157
157 -
 158
158 -
159
-
160
-
161
-
162
-
163
-
164
-
165
-
166
-
167
-
168
-
169
-
170
-
171
-
172
-
173
-
174
-
175
-
176
-
177
-
178
-
179
-
180
-
181
-
182
-
183
-
184
-
185
-
186
-
187
-
188
 |
 |

NOTES TO THE FINANCIAL STATEMENTS
Lenovo Group Limited 2012/13 Annual Report
146
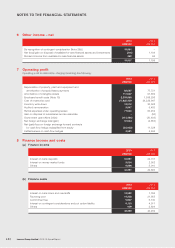
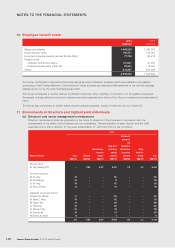
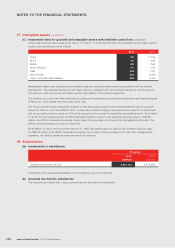
10 Employee benefit costs
2013 2012
US$’000 US$’000
Wages and salaries 1,665,223 1,380,076
Social security costs 148,311 135,657
Long-term incentive awards granted (Notes 30(a)) 77,724 66,418
Pension costs
– Defined contribution plans 131,847 81,067
– Defined benefit plans (Note 36) 22,601 18,350
Others 313,887 256,688
2,359,593 1,938,256
The Group contributes to respective local municipal government retirement schemes which are available to all qualified
employees in the Chinese Mainland. Contributions to these schemes are calculated with reference to the monthly average
salaries as set out by the local municipal government.
The Group participates in various defined contribution schemes, either voluntary or mandatory, for all qualified employees.
The assets of those defined contribution schemes are held separately from those of the Group in independently administered
funds.
The Group also contributes to certain defined benefit pension schemes, details of which are set out in Note 36.
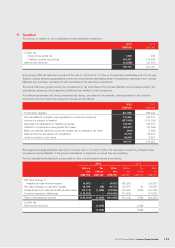
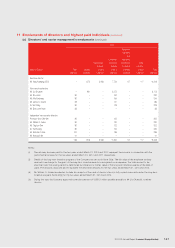
11 Emoluments of directors and highest paid individuals
(a) Directors’ and senior management’s emoluments
Directors’ emoluments comprise payments by the Group to directors of the Company in connection with the
management of the affairs of the Company and its subsidiaries. The remuneration of each director and the chief
executive who is also a director, for the years ended March 31, 2013 and 2012 is set out below:
2013
Name of Director Fees Salaries
Discretionary
bonuses
(note i)
Long-term
incentives
awards
(note ii)
Retirement
payments
and
employer’s
contribution
to pension
schemes
Other
benefits-
in-kind Total
US$’000 US$’000 US$’000 US$’000 US$’000 US$’000 US$’000
Executive director
Mr. Yang Yuanqing (CEO) – 1,188 4,227 8,941 119 131 14,606
Non-executive directors
Mr. Zhu Linan 83 – – 181 – – 264
Ms. Ma Xuezheng 83 – – 73 – – 156
Dr. Wu Yibing 83 – – 181 – – 264
Mr. Zhao John Huan 83 – – 110 – – 193
Independent non-executive directors
Professor Woo Chia-Wei 21––336––357
Mr. William O. Grabe 93––181––274
Mr. Ting Lee Sen 83––183––266
Dr. Tian Suning 83––181––264
Mr. Nicholas C Allen 110 – – 179 – – 289
Mr. Nobuyuki Idei 83––117––200
Mr William Tudor Brown 14––2––16
819 1,188 4,227 10,665 119 131 17,149