Lenovo 2013 Annual Report Download - page 32
Download and view the complete annual report
Please find page 32 of the 2013 Lenovo annual report below. You can navigate through the pages in the report by either clicking on the pages listed below, or by using the keyword search tool below to find specific information within the annual report.-
 1
1 -
2
-
3
-
4
-
5
-
6
-
7
-
8
-
9
-
10
-
11
-
12
-
13
-
14
-
15
-
16
-
17
-
18
-
19
-
20
-
21
-
 22
22 -
 23
23 -
 24
24 -
 25
25 -
 26
26 -
 27
27 -
 28
28 -
 29
29 -
 30
30 -
 31
31 -
 32
32 -
 33
33 -
 34
34 -
 35
35 -
 36
36 -
 37
37 -
 38
38 -
 39
39 -
 40
40 -
 41
41 -
 42
42 -
43
-
44
-
45
-
46
-
47
-
48
-
49
-
50
-
51
-
52
-
53
-
54
-
55
-
56
-
57
-
58
-
59
-
60
-
61
-
62
-
63
-
64
-
65
-
66
-
67
-
68
-
69
-
70
-
71
-
72
-
73
-
74
-
75
-
76
-
77
-
78
-
79
-
80
-
81
-
82
-
83
-
84
-
85
-
86
-
87
-
88
-
89
-
90
-
91
-
92
-
93
-
94
-
95
-
96
-
97
-
98
-
99
-
100
-
101
-
102
-
103
-
104
-
105
-
106
-
107
-
108
-
109
-
110
-
111
-
112
-
113
-
114
-
115
-
116
-
117
-
118
-
119
-
120
-
121
-
122
-
123
-
124
-
125
-
126
-
127
-
128
-
129
-
130
-
131
-
132
-
133
-
134
-
135
-
136
-
137
-
138
-
139
-
140
-
141
-
142
-
143
-
144
-
145
-
146
-
147
-
148
-
149
-
150
-
151
-
152
-
153
-
154
-
155
-
156
-
157
-
158
-
159
-
160
-
161
-
162
-
163
-
164
-
165
-
166
-
167
-
168
-
169
-
170
-
171
-
172
-
173
-
174
-
175
-
176
-
177
-
178
-
179
-
180
-
181
-
182
-
183
-
184
-
185
-
186
-
187
-
188
 |
 |
Lenovo Group Limited 2012/13 Annual Report
30
MANAGEMENT’S DISCUSSION & ANALYSIS
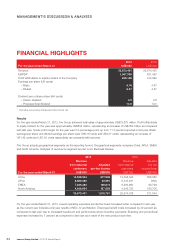
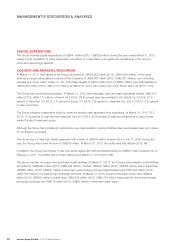
CAPITAL EXPENDITURE
The Group incurred capital expenditure of US$441 million (2012: US$329 million) during the year ended March 31, 2013,
mainly for the acquisition of office equipment, completion of construction-in-progress and investments in the Group’s
information technology systems.
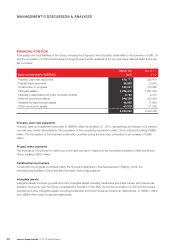
LIQUIDITY AND FINANCIAL RESOURCES
At March 31, 2013, total assets of the Group amounted to US$16,882 million (2012: US$15,861 million), which were
financed by equity attributable to owners of the Company of US$2,667 million (2012: US$2,361 million), non-controlling
interests (net of put option written on non-controlling interest) of US$13 million (2012: US$87 million), and total liabilities of
US$14,202 million (2012: US$13,413 million). At March 31, 2013, the current ratio of the Group was 1.02 (2012: 1.00).
The Group had a solid financial position. At March 31, 2013, bank deposits, cash and cash equivalents totaled US$3,573
million (2012: US$4,171 million), of which 56.5 (2012: 56.9) percent was denominated in US dollars, 32.4 (2012: 27.6)
percent in Renminbi, 3.4 (2012: 7.7) percent in Euros, 3.4 (2012: 3.5) percent in Japanese Yen, and 4.3 (2012: 4.3) percent
in other currencies.
The Group adopts a conservative policy to invest the surplus cash generated from operations. At March 31, 2013, 76.3
(2012: 74.2) percent of cash are bank deposits, and 23.7 (2012: 25.8) percent of cash are investments in liquid money
market funds of investment grade.
Although the Group has consistently maintained a very liquid position, banking facilities have nevertheless been put in place
for contingency purposes.
The Group has a 5-Year loan facility agreement with a bank of US$300 million entered into on July 17, 2009. During the
year, the Group drew down the loan of US$300 million. At March 31, 2013, the facility was fully utilized (2012: Nil).
In addition, the Group has another 5-Year loan facility agreement with syndicated banks for US$500 million entered into on
February 2, 2011. The facility has not been utilized as at March 31, 2013 (2012: Nil).
The Group has also arranged other short-term credit facilities. At March 31, 2013, the Group’s total available credit facilities
amounted to US$6,993 million (2012: US$6,642 million), of which US$391 million (2012: US$362 million) was in trade lines,
US$668 million (2012: US$521 million) in short-term and revolving money market facilities and US$5,934 million (2012:
US$5,759 million) in forward foreign exchange contracts. At March 31, 2013, the amounts drawn down were US$242
million (2012: US$220 million) in trade lines, US$4,945 million (2012: US$4,720 million) being used for the forward foreign
exchange contracts; and US$176 million (2012: US$63 million) in short-term bank loans.