Lenovo 2013 Annual Report Download - page 79
Download and view the complete annual report
Please find page 79 of the 2013 Lenovo annual report below. You can navigate through the pages in the report by either clicking on the pages listed below, or by using the keyword search tool below to find specific information within the annual report.-
 1
1 -
2
-
3
-
4
-
5
-
6
-
7
-
8
-
9
-
10
-
11
-
12
-
13
-
14
-
15
-
16
-
17
-
18
-
19
-
20
-
21
-
22
-
23
-
24
-
25
-
26
-
27
-
28
-
29
-
30
-
31
-
32
-
33
-
34
-
35
-
36
-
37
-
38
-
39
-
40
-
41
-
42
-
43
-
44
-
45
-
46
-
47
-
48
-
49
-
50
-
51
-
52
-
53
-
54
-
55
-
56
-
57
-
58
-
59
-
60
-
61
-
62
-
63
-
64
-
65
-
66
-
67
-
68
-
 69
69 -
 70
70 -
 71
71 -
 72
72 -
 73
73 -
 74
74 -
 75
75 -
 76
76 -
 77
77 -
 78
78 -
 79
79 -
 80
80 -
 81
81 -
 82
82 -
 83
83 -
 84
84 -
 85
85 -
 86
86 -
 87
87 -
 88
88 -
 89
89 -
90
-
91
-
92
-
93
-
94
-
95
-
96
-
97
-
98
-
99
-
100
-
101
-
102
-
103
-
104
-
105
-
106
-
107
-
108
-
109
-
110
-
111
-
112
-
113
-
114
-
115
-
116
-
117
-
118
-
119
-
120
-
121
-
122
-
123
-
124
-
125
-
126
-
127
-
128
-
129
-
130
-
131
-
132
-
133
-
134
-
135
-
136
-
137
-
138
-
139
-
140
-
141
-
142
-
143
-
144
-
145
-
146
-
147
-
148
-
149
-
150
-
151
-
152
-
153
-
154
-
155
-
156
-
157
-
158
-
159
-
160
-
161
-
162
-
163
-
164
-
165
-
166
-
167
-
168
-
169
-
170
-
171
-
172
-
173
-
174
-
175
-
176
-
177
-
178
-
179
-
180
-
181
-
182
-
183
-
184
-
185
-
186
-
187
-
188
 |
 |

2012/13 Annual Report Lenovo Group Limited 77
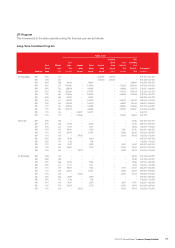
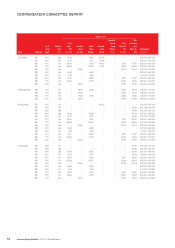
LTI Program
The movements in the share awards during the financial year are as follows:
Long-Term Incentive Program
Number of units
Name Award type
Fiscal
Year of
Award
Effective
price
(HK$)
As at
April 1,
2012
(Unvested)
Awarded
during
the year
Vested
during
the year
Exercised
during
the year
Cancelled/
lapsed
during
the year
(Note 2)
As at
March 31,
2013
(unvested)
Total
outstanding
as at
March 31,
2013
Vesting period
(mm.dd.yyyy)
Mr. Yang Yuanqing SAR 06/07 2.35 – – – 13,385,665 4,318,142 – – 06.01.2007 – 06.01.2010
SAR 07/08 3.94 – – – 6,002,009 2,861,212 – – 06.01.2008 – 06.01.2011
SAR 08/09 5.88 984,963 – 984,964 – – – 3,939,855 06.01.2009 – 06.01.2012
SAR 09/10 3.17 11,400,000 – 5,700,000 – – 5,700,000 22,800,000 05.25,2010 – 05.25,2013
SAR 09/10 5.23 3,298,078 – 1,649,039 – – 1,649,039 6,596,156 02.08.2011 – 02.08.2014
SAR 10/11 4.92 8,272,664 – 2,757,555 – – 5,515,109 11,030,219 02.21.2012 – 02.21.2015
SAR 11/12 6.80 11,132,358 – 2,783,090 – – 8,349,268 11,132,358 02.13.2013 – 02.13.2016
RSU 08/09 5.88 262,657 – 262,657 – – – – 06.01.2009 – 06.01.2012
RSU 09/10 3.17 5,100,000 – 2,550,000 – – 2,550,000 2,550,000 05.25,2010 – 05.25,2013
RSU 09/10 5.23 2,473,559 – 1,236,779 – – 1,236,780 1,236,780 02.08.2011 – 02.08.2014
RSU 10/11 4.92 5,909,046 – 1,969,682 – – 3,939,364 3,939,364 02.21.2012 – 02.21.2015
RSU 11/12 6.80 6,679,415 – 1,669,854 – – 5,009,561 5,009,561 02.13.2013 – 02.13.2016
RSU 11/12 4.30 – 1,322,051 1,322,051 – – – – 06.02.2012
RSU 12/13 6.75 – 1,730,230 – – – 1,730,230 1,730,230 06.01.2013
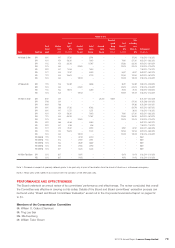
Mr. Zhu Linan SAR 08/09 5.88 – – – – – – 195,980 06.01.2009 – 06.01.2011
SAR 09/10 3.88 87,932 – 87,932 – – – 87,932 08.07.2010 – 08.07.2012
SAR 09/10 4.47 12,721 – 12,721 – – – 38,163 11.30.2010 – 11.30.2012
SAR 10/11 4.59 158,001 – 79,000 – – 79,001 237,001 08.20.2011 – 08.20.2013
SAR 11/12 4.56 323,000 – 107,667 – – 215,333 323,000 08.19.2012 – 08.19.2014
SAR 12/13 6.36 – 274,316 – – – 274,316 274,316 07.03.2013 – 07.03.2015
RSU 09/10 3.88 39,969 – 39,969 – – – – 08.07.2010 – 08.07.2012
RSU 09/10 4.47 5,783 – 5,783 – – – – 11.30.2010 – 11.30.2012
RSU 10/11 4.59 79,001 – 39,500 – – 39,501 39,501 08.20.2011 – 08.20.2013
RSU 11/12 4.56 153,810 – 51,270 – – 102,540 102,540 08.19.2012 – 08.19.2014
RSU 12/13 6.36 – 109,729 – – – 109,729 109,729 07.03.2013 – 07.03.2015
Ms. Ma Xuezheng SAR 07/08 5.62 – – – – – – 693,130 06.01.2008 – 06.01.2011
SAR 08/09 5.88 – – – – – – 195,980 06.01.2009 – 06.01.2011
SAR 09/10 3.88 87,932 – 87,932 – – – 175,864 08.07.2010 – 08.07.2012
SAR 09/10 4.47 12,721 – 12,721 – – – 38,163 11.30.2010 – 11.30.2012
SAR 10/11 4.59 158,001 – 79,000 – – 79,001 237,001 08.20.2011 – 08.20.2013
SAR 11/12 4.56 323,000 – 107,667 – – 215,333 323,000 08.19.2012 – 08.19.2014
SAR 12/13 6.36 – 274,316 – – – 274,316 274,316 07.03.2013 – 07.03.2015
RSU 09/10 3.88 39,969 – 39,969 – – – – 08.07.2010 – 08.07.2012
RSU 09/10 4.47 5,783 – 5,783 – – – – 11.30.2010 – 11.30.2012
RSU 10/11 4.59 79,001 – 39,500 – – 39,501 39,501 08.20.2011 – 08.20.2013
RSU 11/12 4.56 153,810 – 51,270 – – 102,540 102,540 08.19.2012 – 08.19.2014
RSU 12/13 6.36 – 109,729 – – – 109,729 109,729 07.03.2013 – 07.03.2015