Lenovo 2013 Annual Report Download - page 155
Download and view the complete annual report
Please find page 155 of the 2013 Lenovo annual report below. You can navigate through the pages in the report by either clicking on the pages listed below, or by using the keyword search tool below to find specific information within the annual report.-
 1
1 -
2
-
3
-
4
-
5
-
6
-
7
-
8
-
9
-
10
-
11
-
12
-
13
-
14
-
15
-
16
-
17
-
18
-
19
-
20
-
21
-
22
-
23
-
24
-
25
-
26
-
27
-
28
-
29
-
30
-
31
-
32
-
33
-
34
-
35
-
36
-
37
-
38
-
39
-
40
-
41
-
42
-
43
-
44
-
45
-
46
-
47
-
48
-
49
-
50
-
51
-
52
-
53
-
54
-
55
-
56
-
57
-
58
-
59
-
60
-
61
-
62
-
63
-
64
-
65
-
66
-
67
-
68
-
69
-
70
-
71
-
72
-
73
-
74
-
75
-
76
-
77
-
78
-
79
-
80
-
81
-
82
-
83
-
84
-
85
-
86
-
87
-
88
-
89
-
90
-
91
-
92
-
93
-
94
-
95
-
96
-
97
-
98
-
99
-
100
-
101
-
102
-
103
-
104
-
105
-
106
-
107
-
108
-
109
-
110
-
111
-
112
-
113
-
114
-
115
-
116
-
117
-
118
-
119
-
120
-
121
-
122
-
123
-
124
-
125
-
126
-
127
-
128
-
129
-
130
-
131
-
132
-
133
-
134
-
135
-
136
-
137
-
138
-
139
-
140
-
141
-
142
-
143
-
144
-
 145
145 -
 146
146 -
 147
147 -
 148
148 -
 149
149 -
 150
150 -
 151
151 -
 152
152 -
 153
153 -
 154
154 -
 155
155 -
 156
156 -
 157
157 -
 158
158 -
 159
159 -
 160
160 -
 161
161 -
 162
162 -
 163
163 -
 164
164 -
 165
165 -
166
-
167
-
168
-
169
-
170
-
171
-
172
-
173
-
174
-
175
-
176
-
177
-
178
-
179
-
180
-
181
-
182
-
183
-
184
-
185
-
186
-
187
-
188
 |
 |
2012/13 Annual Report Lenovo Group Limited 153
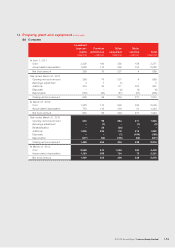
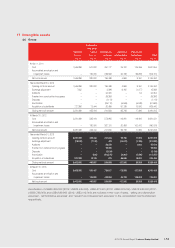
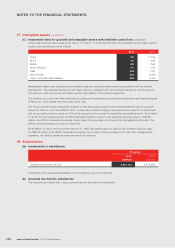
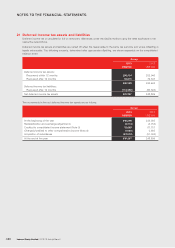
17 Intangible assets
(a) Group
Goodwill
(Note (c))
Trademarks
and trade
names
(Note (c))
Internal use
software
Customer
relationships
Patent and
technology Total
US$’000 US$’000 US$’000 US$’000 US$’000 US$’000
At April 1, 2011
Cost 1,545,859 510,000 451,117 25,122 105,456 2,637,554
Accumulated amortization and
impairment losses – 130,000 256,648 20,159 96,295 503,102
Net book amount 1,545,859 380,000 194,469 4,963 9,161 2,134,452
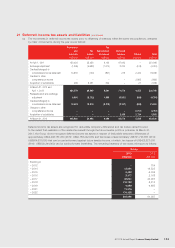
Year ended March 31, 2012
Opening net book amount 1,545,859 380,000 194,469 4,963 9,161 2,134,452
Exchange adjustment 7,852 – 2,396 6,192 (1,077) 15,363
Additions – – 22,300 – 54 22,354
Transfer from construction-in-progress – – 88,393 – – 88,393
Disposals – – (1,113) – – (1,113)
Amortization – – (85,110) (6,526) (6,048) (97,684)
Acquisition of subsidiaries 727,358 75,444 20,499 91,139 15,000 929,440
Closing net book amount 2,281,069 455,444 241,834 95,768 17,090 3,091,205
At March 31, 2012
Cost 2,281,069 585,444 578,965 116,261 119,492 3,681,231
Accumulated amortization and
impairment losses – 130,000 337,131 20,493 102,402 590,026
Net book amount 2,281,069 455,444 241,834 95,768 17,090 3,091,205
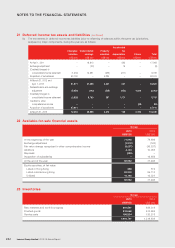
Year ended March 31, 2013
Opening net book amount 2,281,069 455,444 241,834 95,768 17,090 3,091,205
Exchange adjustment (78,358) (7,742) 479 (15,013) (1,196) (101,830)
Additions – – 56,078 – 1,900 57,978
Transfer from construction-in-progress – – 99,260 – – 99,260
Disposals – – (3,124) – – (3,124)
Amortization – (590) (100,570) (9,261) (7,086) (117,507)
Acquisition of subsidiaries 201,269 13,745 876 66,046 18,500 300,436
Closing net book amount 2,403,980 460,857 294,833 137,540 29,208 3,326,418
At March 31, 2013
Cost 2,403,980 591,447 724,817 173,268 137,906 4,031,418
Accumulated amortization and
impairment losses – 130,590 429,984 35,728 108,698 705,000
Net book amount 2,403,980 460,857 294,833 137,540 29,208 3,326,418
Amortization of US$25,206,000 (2012: US$26,445,000), US$9,673,000 (2012: US$9,038,000), US$75,948,000 (2012:
US$58,789,000) and US$6,680,000 (2012: US$3,412,000) are included in the ‘cost of sales’, ‘selling and distribution
expenses’, ‘administrative expenses’ and ‘research and development expenses’ in the consolidated income statement
respectively.