Lenovo 2013 Annual Report Download - page 119
Download and view the complete annual report
Please find page 119 of the 2013 Lenovo annual report below. You can navigate through the pages in the report by either clicking on the pages listed below, or by using the keyword search tool below to find specific information within the annual report.-
 1
1 -
2
-
3
-
4
-
5
-
6
-
7
-
8
-
9
-
10
-
11
-
12
-
13
-
14
-
15
-
16
-
17
-
18
-
19
-
20
-
21
-
22
-
23
-
24
-
25
-
26
-
27
-
28
-
29
-
30
-
31
-
32
-
33
-
34
-
35
-
36
-
37
-
38
-
39
-
40
-
41
-
42
-
43
-
44
-
45
-
46
-
47
-
48
-
49
-
50
-
51
-
52
-
53
-
54
-
55
-
56
-
57
-
58
-
59
-
60
-
61
-
62
-
63
-
64
-
65
-
66
-
67
-
68
-
69
-
70
-
71
-
72
-
73
-
74
-
75
-
76
-
77
-
78
-
79
-
80
-
81
-
82
-
83
-
84
-
85
-
86
-
87
-
88
-
89
-
90
-
91
-
92
-
93
-
94
-
95
-
96
-
97
-
98
-
99
-
100
-
101
-
102
-
103
-
104
-
105
-
106
-
107
-
108
-
 109
109 -
 110
110 -
 111
111 -
 112
112 -
 113
113 -
 114
114 -
 115
115 -
 116
116 -
 117
117 -
 118
118 -
 119
119 -
 120
120 -
 121
121 -
 122
122 -
 123
123 -
 124
124 -
 125
125 -
 126
126 -
 127
127 -
 128
128 -
 129
129 -
130
-
131
-
132
-
133
-
134
-
135
-
136
-
137
-
138
-
139
-
140
-
141
-
142
-
143
-
144
-
145
-
146
-
147
-
148
-
149
-
150
-
151
-
152
-
153
-
154
-
155
-
156
-
157
-
158
-
159
-
160
-
161
-
162
-
163
-
164
-
165
-
166
-
167
-
168
-
169
-
170
-
171
-
172
-
173
-
174
-
175
-
176
-
177
-
178
-
179
-
180
-
181
-
182
-
183
-
184
-
185
-
186
-
187
-
188
 |
 |
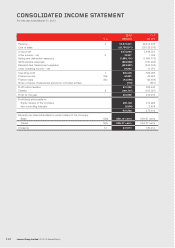
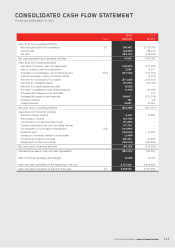
CONSOLIDATED CASH FLOW STATEMENT
For the year ended March 31, 2013
2012/13 Annual Report Lenovo Group Limited 117
2013 2012
Note US$’000 US$’000
Cash flows from operating activities
Net cash generated from operations 35 245,383 2,126,765
Interest paid (33,452) (38,477)
Tax paid (192,401) (148,332)
Net cash generated from operating activities 19,530 1,939,956
Cash flows from investing activities
Purchase of property, plant and equipment (106,331) (101,238)
Sale of property, plant and equipment 2,266 6,311
Acquisition of subsidiaries, net of cash acquired 37(c) (137,052) (172,316)
Interests acquired in jointly controlled entities –(3,237)
Payment for construction-in-progress (277,003) (205,601)
Payment for intangible assets (57,978) (22,354)
Payment for prepaid lease payments (5,026) –
Purchase of available-for-sale financial assets (4,104) (10,055)
Proceeds from disposal of an associate –145
Decrease/(increase) in bank deposits 294,617 (371,514)
Dividend received 362 95
Interest received 44,881 42,693
Net cash used in investing activities (245,368) (837,071)
Cash flows from financing activities
Exercise of share options 6,403 10,889
Repurchase of shares (44,122) –
Contributions to employee share trusts (91,280) –
Capital contribution from non-controlling interest 147,700 –
De-recognition of contingent consideration 29(i) (119,991) –
Dividends paid (194,676) (114,687)
Increase in ownership interest in a subsidiary (1,493) –
Proceeds from bank borrowings 360,230 41,498
Repayments of bank borrowings (130,974) (253,224)
Net cash used in financing activities (68,203) (315,524)
(Decrease)/increase in cash and cash equivalents (294,041) 787,361
Effect of foreign exchange rate changes (9,529) 15,793
Cash and cash equivalents at the beginning of the year 3,757,652 2,954,498
Cash and cash equivalents at the end of the year 25 3,454,082 3,757,652