Lenovo 2013 Annual Report Download - page 33
Download and view the complete annual report
Please find page 33 of the 2013 Lenovo annual report below. You can navigate through the pages in the report by either clicking on the pages listed below, or by using the keyword search tool below to find specific information within the annual report.-
 1
1 -
2
-
3
-
4
-
5
-
6
-
7
-
8
-
9
-
10
-
11
-
12
-
13
-
14
-
15
-
16
-
17
-
18
-
19
-
20
-
21
-
22
-
 23
23 -
 24
24 -
 25
25 -
 26
26 -
 27
27 -
 28
28 -
 29
29 -
 30
30 -
 31
31 -
 32
32 -
 33
33 -
 34
34 -
 35
35 -
 36
36 -
 37
37 -
 38
38 -
 39
39 -
 40
40 -
 41
41 -
 42
42 -
 43
43 -
44
-
45
-
46
-
47
-
48
-
49
-
50
-
51
-
52
-
53
-
54
-
55
-
56
-
57
-
58
-
59
-
60
-
61
-
62
-
63
-
64
-
65
-
66
-
67
-
68
-
69
-
70
-
71
-
72
-
73
-
74
-
75
-
76
-
77
-
78
-
79
-
80
-
81
-
82
-
83
-
84
-
85
-
86
-
87
-
88
-
89
-
90
-
91
-
92
-
93
-
94
-
95
-
96
-
97
-
98
-
99
-
100
-
101
-
102
-
103
-
104
-
105
-
106
-
107
-
108
-
109
-
110
-
111
-
112
-
113
-
114
-
115
-
116
-
117
-
118
-
119
-
120
-
121
-
122
-
123
-
124
-
125
-
126
-
127
-
128
-
129
-
130
-
131
-
132
-
133
-
134
-
135
-
136
-
137
-
138
-
139
-
140
-
141
-
142
-
143
-
144
-
145
-
146
-
147
-
148
-
149
-
150
-
151
-
152
-
153
-
154
-
155
-
156
-
157
-
158
-
159
-
160
-
161
-
162
-
163
-
164
-
165
-
166
-
167
-
168
-
169
-
170
-
171
-
172
-
173
-
174
-
175
-
176
-
177
-
178
-
179
-
180
-
181
-
182
-
183
-
184
-
185
-
186
-
187
-
188
 |
 |

2012/13 Annual Report Lenovo Group Limited 31
PIO
NE
ER
PIO
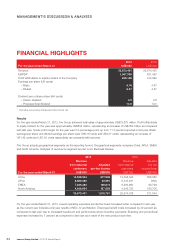
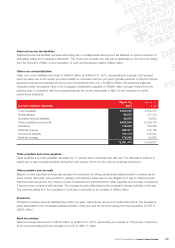
At March 31, 2013, the Group’s outstanding bank loans represented the term loan of US$303 million (2012: Nil) and short-
term bank loans of US$176 million (2012: US$63 million). When compared with total equity of US$2,680 million (2012:
US$2,448 million), the Group’s gearing ratio was 0.18 (2012: 0.03). The net cash position of the Group at March 31, 2013
is US$3,094 million (2012: US$4,108 million).
The Group is confident that all the loan and other short-term credit facilities on hand can meet the funding requirements of
the Group’s operations and business development.
2013 2012
At March 31 US$’000 US$’000
Bank deposits and cash and cash equivalents 3,573 4,171
Less: total borrowings (479) (63)
3,094 4,108
The Group adopts a consistent hedging policy for business transactions to reduce the risk of currency fluctuation arising
from daily operations. At March 31, 2013, the Group had commitments in respect of outstanding forward foreign exchange
contracts amounting to US$4,945 million (2012: US$4,720 million).
The Group’s forward foreign exchange contracts are either used to hedge a percentage of future transactions which are
highly probable, or used as fair value hedges for identified assets and liabilities.
CONTINGENT LIABILITIES
The Group, in the ordinary course of its business, is involved in various claims, suits, investigations, and legal proceedings
that arise from time to time. Although the Group does not expect that the outcome in any of these legal proceedings,
individually or collectively, will have a material adverse effect on its financial position or results of operations, litigation
is inherently unpredictable. Therefore, the Group could incur judgments or enter into settlements of claims that could
adversely affect its operating results or cash flows in a particular period.
HUMAN RESOURCES
At March 31, 2013, the Group had approximately 35,026 employees.
The Group implements remuneration policy, bonus and long-term incentive schemes with reference to the performance of
the Group and individual employees. The Group also provides benefits such as insurance, medical and retirement funds to
employees to sustain competitiveness of the Group.