Lenovo 2013 Annual Report Download - page 146
Download and view the complete annual report
Please find page 146 of the 2013 Lenovo annual report below. You can navigate through the pages in the report by either clicking on the pages listed below, or by using the keyword search tool below to find specific information within the annual report.-
 1
1 -
2
-
3
-
4
-
5
-
6
-
7
-
8
-
9
-
10
-
11
-
12
-
13
-
14
-
15
-
16
-
17
-
18
-
19
-
20
-
21
-
22
-
23
-
24
-
25
-
26
-
27
-
28
-
29
-
30
-
31
-
32
-
33
-
34
-
35
-
36
-
37
-
38
-
39
-
40
-
41
-
42
-
43
-
44
-
45
-
46
-
47
-
48
-
49
-
50
-
51
-
52
-
53
-
54
-
55
-
56
-
57
-
58
-
59
-
60
-
61
-
62
-
63
-
64
-
65
-
66
-
67
-
68
-
69
-
70
-
71
-
72
-
73
-
74
-
75
-
76
-
77
-
78
-
79
-
80
-
81
-
82
-
83
-
84
-
85
-
86
-
87
-
88
-
89
-
90
-
91
-
92
-
93
-
94
-
95
-
96
-
97
-
98
-
99
-
100
-
101
-
102
-
103
-
104
-
105
-
106
-
107
-
108
-
109
-
110
-
111
-
112
-
113
-
114
-
115
-
116
-
117
-
118
-
119
-
120
-
121
-
122
-
123
-
124
-
125
-
126
-
127
-
128
-
129
-
130
-
131
-
132
-
133
-
134
-
135
-
 136
136 -
 137
137 -
 138
138 -
 139
139 -
 140
140 -
 141
141 -
 142
142 -
 143
143 -
 144
144 -
 145
145 -
 146
146 -
 147
147 -
 148
148 -
 149
149 -
 150
150 -
 151
151 -
 152
152 -
 153
153 -
 154
154 -
 155
155 -
 156
156 -
157
-
158
-
159
-
160
-
161
-
162
-
163
-
164
-
165
-
166
-
167
-
168
-
169
-
170
-
171
-
172
-
173
-
174
-
175
-
176
-
177
-
178
-
179
-
180
-
181
-
182
-
183
-
184
-
185
-
186
-
187
-
188
 |
 |
NOTES TO THE FINANCIAL STATEMENTS
Lenovo Group Limited 2012/13 Annual Report
144
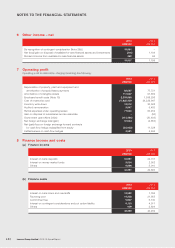
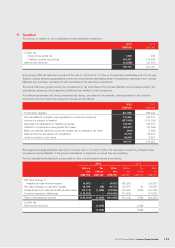
6 Other income – net
2013 2012
US$’000 US$’000
De-recognition of contingent consideration (Note 29(i)) 19,861 –
Net (loss)/gain on disposal of available-for-sale financial assets and investments (316) 1,104
Dividend income from available-for-sale financial assets 362 95
19,907 1,199
7 Operating profit
Operating profit is stated after charging/(crediting) the following:
2013 2012
US$’000 US$’000
Depreciation of property, plant and equipment and
amortization of prepaid lease payments 92,097 77,721
Amortization of intangible assets 117,507 97,684
Employee benefit costs (Note 10) 2,359,593 1,938,256
Cost of inventories sold 27,825,429 24,229,947
Inventory write-down 13,012 30,588
Auditor’s remuneration 5,567 5,483
Rental expenses under operating leases 77,530 63,252
Gain on disposal of subsidiaries and an associate –(50)
Government grant (Note 29(iv)) (115,366) (30,493)
Net foreign exchange loss/(gain) 37,634 (4,653)
Net (gain)/loss on foreign exchange forward contracts
for cash flow hedge reclassified from equity (20,953) 11,338
Ineffectiveness on cash flow hedges 3,581 4,495
8 Finance income and costs
(a) Finance income
2013 2012
US$’000 US$’000
Interest on bank deposits 34,981 34,731
Interest on money market funds 3,004 2,952
Others 6,896 5,010
44,881 42,693
(b) Finance costs
2013 2012
US$’000 US$’000
Interest on bank loans and overdrafts 12,592 7,794
Factoring cost 14,358 21,955
Commitment fee 5,907 6,130
Interest on contingent considerations and put option liability 9,103 4,911
Others 909 2,694
42,869 43,484