Lenovo 2010 Annual Report Download - page 98
Download and view the complete annual report
Please find page 98 of the 2010 Lenovo annual report below. You can navigate through the pages in the report by either clicking on the pages listed below, or by using the keyword search tool below to find specific information within the annual report.-
 1
1 -
2
-
3
-
4
-
5
-
6
-
7
-
8
-
9
-
10
-
11
-
12
-
13
-
14
-
15
-
16
-
17
-
18
-
19
-
20
-
21
-
22
-
23
-
24
-
25
-
26
-
27
-
28
-
29
-
30
-
31
-
32
-
33
-
34
-
35
-
36
-
37
-
38
-
39
-
40
-
41
-
42
-
43
-
44
-
45
-
46
-
47
-
48
-
49
-
50
-
51
-
52
-
53
-
54
-
55
-
56
-
57
-
58
-
59
-
60
-
61
-
62
-
63
-
64
-
65
-
66
-
67
-
68
-
69
-
70
-
71
-
72
-
73
-
74
-
75
-
76
-
77
-
78
-
79
-
80
-
81
-
82
-
83
-
84
-
85
-
86
-
87
-
 88
88 -
 89
89 -
 90
90 -
 91
91 -
 92
92 -
 93
93 -
 94
94 -
 95
95 -
 96
96 -
 97
97 -
 98
98 -
 99
99 -
 100
100 -
 101
101 -
 102
102 -
 103
103 -
 104
104 -
 105
105 -
 106
106 -
 107
107 -
 108
108 -
109
-
110
-
111
-
112
-
113
-
114
-
115
-
116
-
117
-
118
-
119
-
120
-
121
-
122
-
123
-
124
-
125
-
126
-
127
-
128
-
129
-
130
-
131
-
132
-
133
-
134
-
135
-
136
-
137
-
138
-
139
-
140
-
141
-
142
-
143
-
144
-
145
-
146
-
147
-
148
-
149
-
150
-
151
-
152
 |
 |

2009/10 Annual Report Lenovo Group Limited
96
NOTES TO THE FINANCIAL STATEMENTS (continued)
2009/10 Annual Report Lenovo Group Limited
96
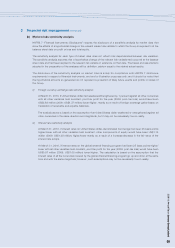
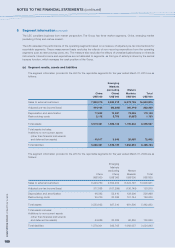
3 Financial risk management (continued)
(c) Capital risks management
The Group’s objectives when managing capital are to safeguard the Group’s ability to continue as a going concern
in order to provide returns for shareholders and benefits for other stakeholders and to maintain an optimal capital
structure to reduce the cost of capital.
In order to maintain or adjust the capital structure, the Group may adjust the amount of dividends paid to
shareholders, return capital to shareholders, issue new shares or sell assets to reduce debt.
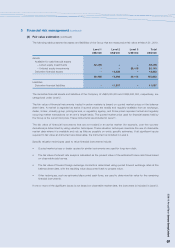
Consistent with others in the industry, the Group monitors capital on the basis of the gearing ratio. This ratio is
calculated as total borrowings (including current and non-current borrowings) divided by total equity.
The Group’s strategy remains unchanged and the gearing ratios and the net cash position of the Group as at March
31, 2010 and 2009 are as follows:
2010 2009
US$ million US$ million
Bank deposits and cash and cash equivalents (Note 25) 2,439 1,863
Less: total borrowings (495) (685)
Net cash position 1,944 1,178
Total equity 1,606 1,311
Gearing ratio 0.31 0.52
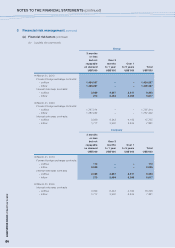
(d) Fair value estimation
Effective April 1, 2009, the Group adopted the amendment to HKFRS 7 for financial instruments that are measured in
the balance sheet at fair value, this requires disclosure of fair value measurements by level of the following fair value
measurement hierarchy:
• Level 1 Quoted prices (unadjusted) in active markets for identical assets or liabilities.
• Level 2 Inputs other than quoted prices included within level 1 that are observable for the asset or liability,
either directly (that is, as prices) or indirectly (that is, derived from prices).
• Level 3 Inputs for the asset or liability that are not based on observable market date (that is, unobservable
inputs)