Lenovo 2010 Annual Report Download - page 75
Download and view the complete annual report
Please find page 75 of the 2010 Lenovo annual report below. You can navigate through the pages in the report by either clicking on the pages listed below, or by using the keyword search tool below to find specific information within the annual report.-
 1
1 -
2
-
3
-
4
-
5
-
6
-
7
-
8
-
9
-
10
-
11
-
12
-
13
-
14
-
15
-
16
-
17
-
18
-
19
-
20
-
21
-
22
-
23
-
24
-
25
-
26
-
27
-
28
-
29
-
30
-
31
-
32
-
33
-
34
-
35
-
36
-
37
-
38
-
39
-
40
-
41
-
42
-
43
-
44
-
45
-
46
-
47
-
48
-
49
-
50
-
51
-
52
-
53
-
54
-
55
-
56
-
57
-
58
-
59
-
60
-
61
-
62
-
63
-
64
-
 65
65 -
 66
66 -
 67
67 -
 68
68 -
 69
69 -
 70
70 -
 71
71 -
 72
72 -
 73
73 -
 74
74 -
 75
75 -
 76
76 -
 77
77 -
 78
78 -
 79
79 -
 80
80 -
 81
81 -
 82
82 -
 83
83 -
 84
84 -
 85
85 -
86
-
87
-
88
-
89
-
90
-
91
-
92
-
93
-
94
-
95
-
96
-
97
-
98
-
99
-
100
-
101
-
102
-
103
-
104
-
105
-
106
-
107
-
108
-
109
-
110
-
111
-
112
-
113
-
114
-
115
-
116
-
117
-
118
-
119
-
120
-
121
-
122
-
123
-
124
-
125
-
126
-
127
-
128
-
129
-
130
-
131
-
132
-
133
-
134
-
135
-
136
-
137
-
138
-
139
-
140
-
141
-
142
-
143
-
144
-
145
-
146
-
147
-
148
-
149
-
150
-
151
-
152
 |
 |
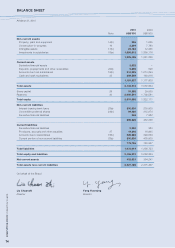
2009/10 Annual Report Lenovo Group Limited
7373
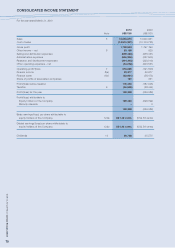
2010 2009 2008
Note US$’000 US$’000 US$’000
Share capital 29 31,388 29,530 29,699
Reserves 1,574,453 1,281,208 1,583,390
Equity attributable to owners of the Company 1,605,841 1,310,738 1,613,089
Minority interests 177 177 174
Total equity 1,606,018 1,310,915 1,613,263
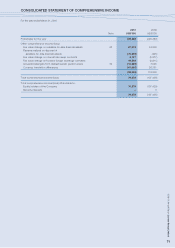
Non-current liabilities
Interest-bearing bank loans 28(a) 200,000 230,000 465,000
Convertible preferred shares 28(b) 94,980 215,974 211,181
Warranty provision 27 301,234 170,008 209,071
Deferred revenue 218,034 118,993 88,701
Retirement benefit obligations 36 80,867 68,000 85,490
Derivative financial liabilities 248 7,382 1,788
Deferred tax liabilities 21 10,331 – –
Other non-current liabilities 24,863 33,864 36,892
930,557 844,221 1,098,123
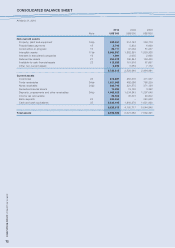
Current liabilities
Trade payables 26(a) 3,141,426 1,635,290 2,226,129
Notes payable 26(b) 94,427 34,180 46,421
Derivative financial liabilities 11,259 23,674 18,197
Provisions, accruals and other payables 27 2,585,850 2,022,758 2,159,422
Income tax payable 84,329 89,459 87,209
Short-term bank loans 64,706 20,293 61,130
Current portion of non-current liabilities 28(c) 437,356 640,873 229,427
6,419,353 4,466,527 4,827,935
Total liabilities 7,349,910 5,310,748 5,926,058
Total equity and liabilities 8,955,928 6,621,663 7,539,321
Net current (liabilities)/assets (183,740) (365,810) 216,905
Total assets less current liabilities 2,536,575 2,155,136 2,711,386
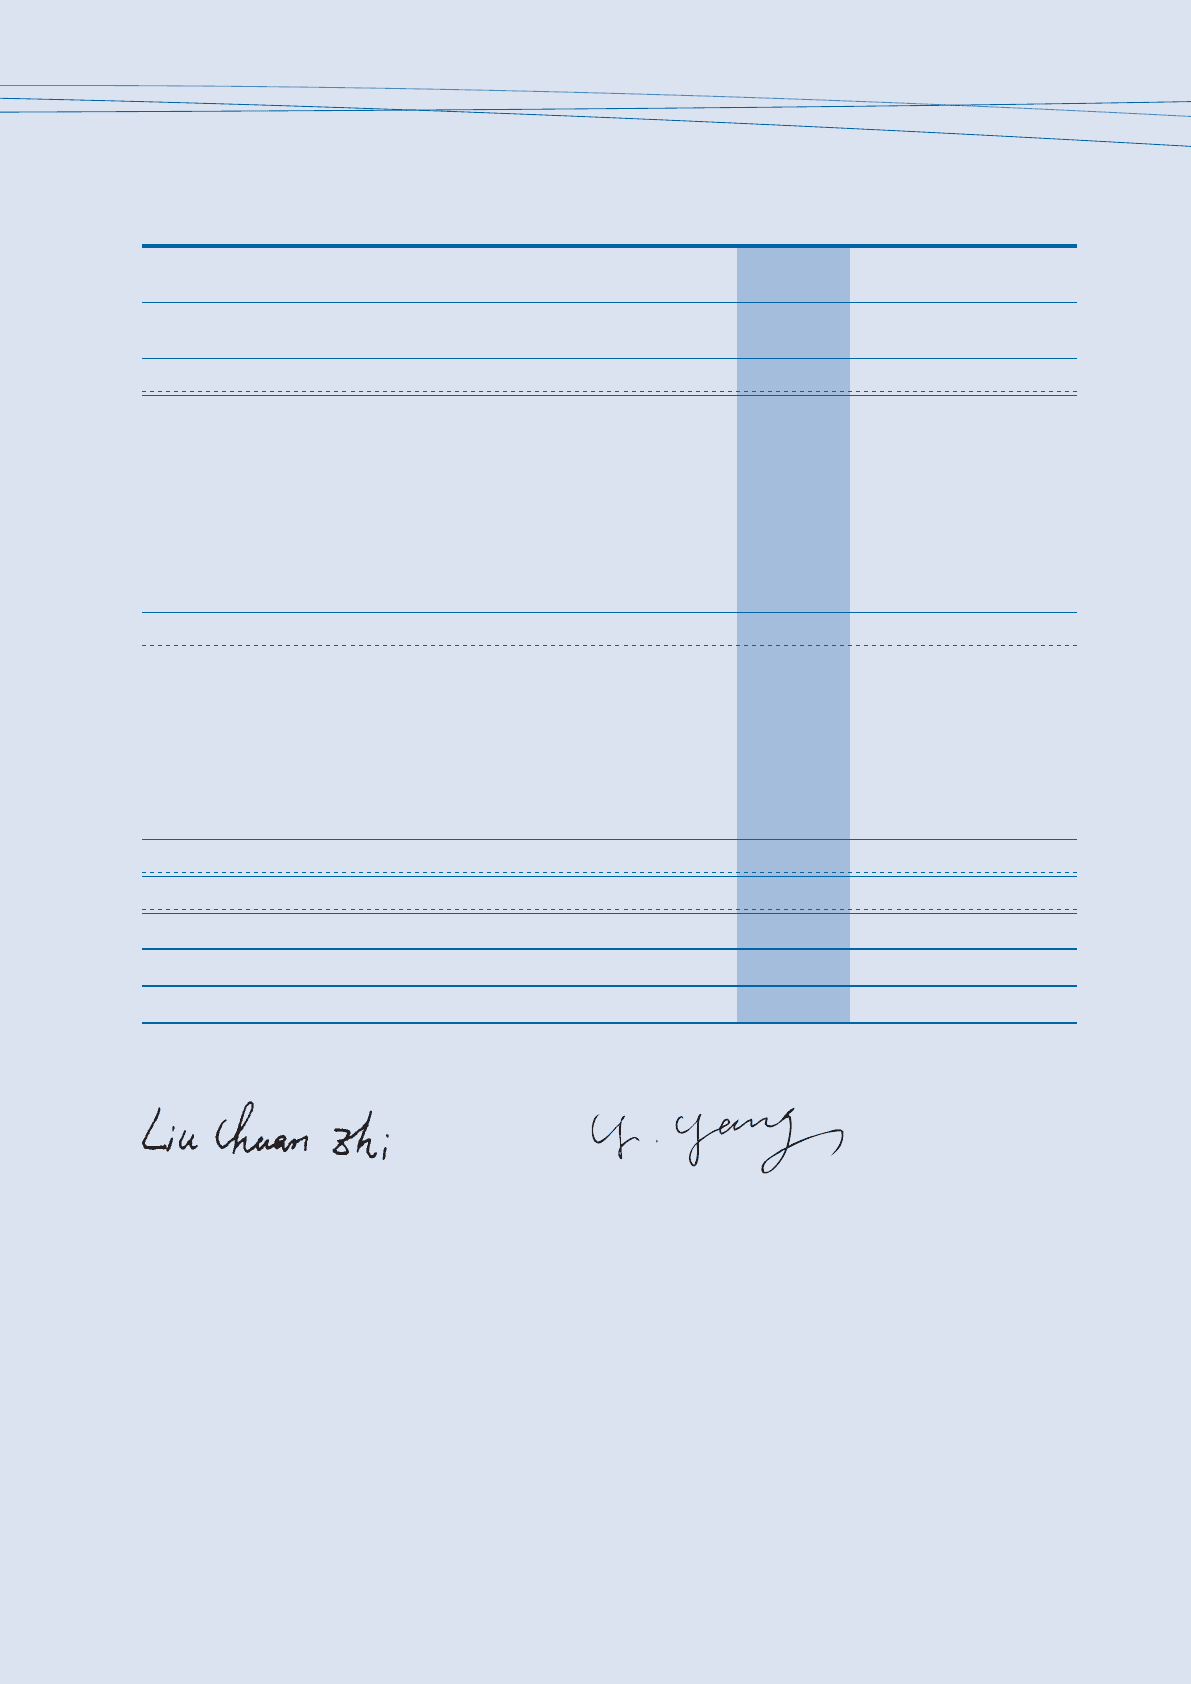
On behalf of the Board
Liu Chuanzhi Yang Yuanqing
Director Director