Lenovo 2010 Annual Report Download - page 103
Download and view the complete annual report
Please find page 103 of the 2010 Lenovo annual report below. You can navigate through the pages in the report by either clicking on the pages listed below, or by using the keyword search tool below to find specific information within the annual report.-
 1
1 -
2
-
3
-
4
-
5
-
6
-
7
-
8
-
9
-
10
-
11
-
12
-
13
-
14
-
15
-
16
-
17
-
18
-
19
-
20
-
21
-
22
-
23
-
24
-
25
-
26
-
27
-
28
-
29
-
30
-
31
-
32
-
33
-
34
-
35
-
36
-
37
-
38
-
39
-
40
-
41
-
42
-
43
-
44
-
45
-
46
-
47
-
48
-
49
-
50
-
51
-
52
-
53
-
54
-
55
-
56
-
57
-
58
-
59
-
60
-
61
-
62
-
63
-
64
-
65
-
66
-
67
-
68
-
69
-
70
-
71
-
72
-
73
-
74
-
75
-
76
-
77
-
78
-
79
-
80
-
81
-
82
-
83
-
84
-
85
-
86
-
87
-
88
-
89
-
90
-
91
-
92
-
 93
93 -
 94
94 -
 95
95 -
 96
96 -
 97
97 -
 98
98 -
 99
99 -
 100
100 -
 101
101 -
 102
102 -
 103
103 -
 104
104 -
 105
105 -
 106
106 -
 107
107 -
 108
108 -
 109
109 -
 110
110 -
 111
111 -
 112
112 -
 113
113 -
114
-
115
-
116
-
117
-
118
-
119
-
120
-
121
-
122
-
123
-
124
-
125
-
126
-
127
-
128
-
129
-
130
-
131
-
132
-
133
-
134
-
135
-
136
-
137
-
138
-
139
-
140
-
141
-
142
-
143
-
144
-
145
-
146
-
147
-
148
-
149
-
150
-
151
-
152
 |
 |

2009/10 Annual Report Lenovo Group Limited
101101
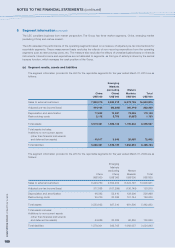
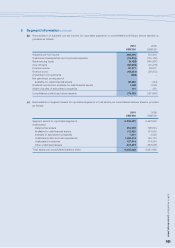
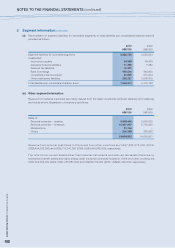
5 Segment information (continued)
(b) Reconciliation of adjusted pre-tax income for reportable segments to consolidated profit/(loss) before taxation is
provided as follows:
2010 2009
US$’000 US$’000
Adjusted pre-tax income 282,420 133,810
Unallocated headquarters and corporate expenses (78,819) (110,136)
Restructuring costs (5,123) (145,927)
One-off items (62,918) (70,476)
Finance income 20,377 59,977
Finance costs (62,881) (56,473)
Impairment of investments (522) –
Net gain/(loss) on disposal of
available-for-sales financial assets 82,090 (124)
Dividend income from available-for-sale financial assets 1,558 1,053
Share of profits of associated companies 121 351
Consolidated profit/(loss) before taxation 176,303 (187,945)
(c) Reconciliation of segment assets for reportable segments to total assets per consolidated balance sheet is provided
as follows:
2010 2009
US$’000 US$’000
Segment assets for reportable segments 6,305,527 5,442,932
Unallocated:
Deferred tax assets 254,978 190,844
Available-for-sale financial assets 112,520 101,916
Interests in associated companies 1,061 2,635
Unallocated cash and cash equivalents 1,499,419 145,174
Unallocated inventories 157,544 174,254
Other unallocated assets 624,879 563,908
Total assets per consolidated balance sheet 8,955,928 6,621,663