Lenovo 2010 Annual Report Download - page 104
Download and view the complete annual report
Please find page 104 of the 2010 Lenovo annual report below. You can navigate through the pages in the report by either clicking on the pages listed below, or by using the keyword search tool below to find specific information within the annual report.-
 1
1 -
2
-
3
-
4
-
5
-
6
-
7
-
8
-
9
-
10
-
11
-
12
-
13
-
14
-
15
-
16
-
17
-
18
-
19
-
20
-
21
-
22
-
23
-
24
-
25
-
26
-
27
-
28
-
29
-
30
-
31
-
32
-
33
-
34
-
35
-
36
-
37
-
38
-
39
-
40
-
41
-
42
-
43
-
44
-
45
-
46
-
47
-
48
-
49
-
50
-
51
-
52
-
53
-
54
-
55
-
56
-
57
-
58
-
59
-
60
-
61
-
62
-
63
-
64
-
65
-
66
-
67
-
68
-
69
-
70
-
71
-
72
-
73
-
74
-
75
-
76
-
77
-
78
-
79
-
80
-
81
-
82
-
83
-
84
-
85
-
86
-
87
-
88
-
89
-
90
-
91
-
92
-
93
-
 94
94 -
 95
95 -
 96
96 -
 97
97 -
 98
98 -
 99
99 -
 100
100 -
 101
101 -
 102
102 -
 103
103 -
 104
104 -
 105
105 -
 106
106 -
 107
107 -
 108
108 -
 109
109 -
 110
110 -
 111
111 -
 112
112 -
 113
113 -
 114
114 -
115
-
116
-
117
-
118
-
119
-
120
-
121
-
122
-
123
-
124
-
125
-
126
-
127
-
128
-
129
-
130
-
131
-
132
-
133
-
134
-
135
-
136
-
137
-
138
-
139
-
140
-
141
-
142
-
143
-
144
-
145
-
146
-
147
-
148
-
149
-
150
-
151
-
152
 |
 |

2009/10 Annual Report Lenovo Group Limited
102
NOTES TO THE FINANCIAL STATEMENTS (continued)
102
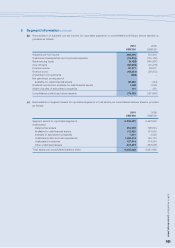
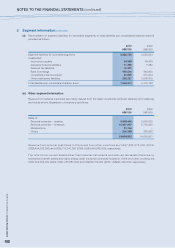
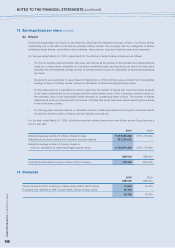
5 Segment information (continued)
(d) Reconciliation of segment liabilities for reportable segments to total liabilities per consolidated balance sheet is
provided as follows:
2010 2009
US$’000 US$’000
Segment liabilities for reportable segments 6,426,784 3,024,063
Unallocated:
Income tax payable 84,329 89,459
Derivative financial liabilities 11,259 7,382
Deferred tax liabilities 10,331 –
Bank borrowings 430,000 465,000
Convertible preferred shares 94,980 215,974
Other unallocated liabilities 292,227 1,508,870
Total liabilities per consolidated balance sheet 7,349,910 5,310,748
(e) Other segment information
Revenue from external customers are mainly derived from the sales of personal computer (desktop and notebook)
and mobile phone. Breakdown of revenue is as follows:
2010 2009
US$’000 US$’000
Sales of:
Personal computer – desktop 5,859,405 5,905,620
Personal computer – notebook 10,437,927 8,730,045
Mobile phone 91,144 –
Others 216,339 265,266
16,604,815 14,900,931
Revenue from external customers in China and from other countries are US$7,892,275,000 (2009:
US$6,434,032,000) and US$8,712,540,000 (2009: US$8,466,899,000), respectively.
The total of non-current assets other than financial instruments and deferred tax assets (there are no
employment benefit assets and rights arising under insurance contracts) located in China and other countries are
US$1,402,505,000 (2009: US$1,236,887,000) and US$950,312,000 (2009: US$991,299,000), respectively.