Lenovo 2010 Annual Report Download - page 125
Download and view the complete annual report
Please find page 125 of the 2010 Lenovo annual report below. You can navigate through the pages in the report by either clicking on the pages listed below, or by using the keyword search tool below to find specific information within the annual report.-
 1
1 -
2
-
3
-
4
-
5
-
6
-
7
-
8
-
9
-
10
-
11
-
12
-
13
-
14
-
15
-
16
-
17
-
18
-
19
-
20
-
21
-
22
-
23
-
24
-
25
-
26
-
27
-
28
-
29
-
30
-
31
-
32
-
33
-
34
-
35
-
36
-
37
-
38
-
39
-
40
-
41
-
42
-
43
-
44
-
45
-
46
-
47
-
48
-
49
-
50
-
51
-
52
-
53
-
54
-
55
-
56
-
57
-
58
-
59
-
60
-
61
-
62
-
63
-
64
-
65
-
66
-
67
-
68
-
69
-
70
-
71
-
72
-
73
-
74
-
75
-
76
-
77
-
78
-
79
-
80
-
81
-
82
-
83
-
84
-
85
-
86
-
87
-
88
-
89
-
90
-
91
-
92
-
93
-
94
-
95
-
96
-
97
-
98
-
99
-
100
-
101
-
102
-
103
-
104
-
105
-
106
-
107
-
108
-
109
-
110
-
111
-
112
-
113
-
114
-
 115
115 -
 116
116 -
 117
117 -
 118
118 -
 119
119 -
 120
120 -
 121
121 -
 122
122 -
 123
123 -
 124
124 -
 125
125 -
 126
126 -
 127
127 -
 128
128 -
 129
129 -
 130
130 -
 131
131 -
 132
132 -
 133
133 -
 134
134 -
 135
135 -
136
-
137
-
138
-
139
-
140
-
141
-
142
-
143
-
144
-
145
-
146
-
147
-
148
-
149
-
150
-
151
-
152
 |
 |

2009/10 Annual Report Lenovo Group Limited
123123
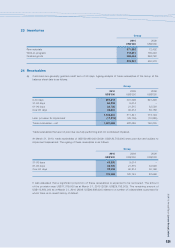
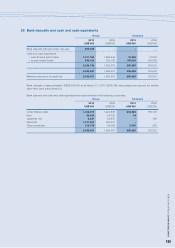
25 Bank deposits and cash and cash equivalents
Group Company
2010 2009 2010 2009
US$’000 US$’000 US$’000 US$’000
Bank deposits matured within one year 200,456 – – –
Cash and cash equivalents
– cash at bank and in hand 1,707,766 1,509,244 79,559 13,618
– money market funds 530,429 354,135 180,000 150,000
2,238,195 1,863,379 259,559 163,618
2,438,651 1,863,379 259,559 163,618
Maximum exposure to credit risk 2,438,651 1,863,379 259,559 163,618
Bank deposits of approximately US$28,000,000 as at March 31, 2010 (2009: Nil) were pledged as security for certain
short-term bank loans (Note 32).
Bank deposits and cash and cash equivalents are denominated in the following currencies:
Group Company
2010 2009 2010 2009
US$’000 US$’000 US$’000 US$’000
United States dollar 1,046,513 1,224,838 254,022 163,146
Euro 38,602 52,083 44 –
Japanese Yen 3,827 34,637 – 109
Renminbi 1,137,606 456,337 – –
Other currencies 212,103 95,484 5,493 363
2,438,651 1,863,379 259,559 163,618