Lenovo 2010 Annual Report Download - page 43
Download and view the complete annual report
Please find page 43 of the 2010 Lenovo annual report below. You can navigate through the pages in the report by either clicking on the pages listed below, or by using the keyword search tool below to find specific information within the annual report.-
 1
1 -
2
-
3
-
4
-
5
-
6
-
7
-
8
-
9
-
10
-
11
-
12
-
13
-
14
-
15
-
16
-
17
-
18
-
19
-
20
-
21
-
22
-
23
-
24
-
25
-
26
-
27
-
28
-
29
-
30
-
31
-
32
-
 33
33 -
 34
34 -
 35
35 -
 36
36 -
 37
37 -
 38
38 -
 39
39 -
 40
40 -
 41
41 -
 42
42 -
 43
43 -
 44
44 -
 45
45 -
 46
46 -
 47
47 -
 48
48 -
 49
49 -
 50
50 -
 51
51 -
 52
52 -
 53
53 -
54
-
55
-
56
-
57
-
58
-
59
-
60
-
61
-
62
-
63
-
64
-
65
-
66
-
67
-
68
-
69
-
70
-
71
-
72
-
73
-
74
-
75
-
76
-
77
-
78
-
79
-
80
-
81
-
82
-
83
-
84
-
85
-
86
-
87
-
88
-
89
-
90
-
91
-
92
-
93
-
94
-
95
-
96
-
97
-
98
-
99
-
100
-
101
-
102
-
103
-
104
-
105
-
106
-
107
-
108
-
109
-
110
-
111
-
112
-
113
-
114
-
115
-
116
-
117
-
118
-
119
-
120
-
121
-
122
-
123
-
124
-
125
-
126
-
127
-
128
-
129
-
130
-
131
-
132
-
133
-
134
-
135
-
136
-
137
-
138
-
139
-
140
-
141
-
142
-
143
-
144
-
145
-
146
-
147
-
148
-
149
-
150
-
151
-
152
 |
 |

2009/10 Annual Report Lenovo Group Limited
41
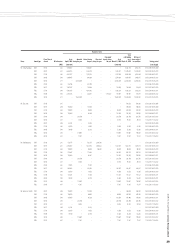
Number of units
Name Award type
Fiscal Year of
Award Effective price
As at
April 1, 2009
Awarded
during the year
Vested during
the year
Exercised
during the year
Cancelled/
lapsed during
the year
As at
March 31, 2010
Total
outstanding
as at
March 31, 2010
Max no. of
shares subject
to conditions Vesting period
(HK$) (unvested) (unvested) (mm.dd.yyyy)
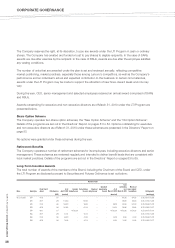
Dr. Tian Suning SAR 07/08 5.14 101,300 – 50,650 – – 50,650 151,950 151,950 09.01.2008-09.01.2010
SAR 08/09 5.88 195,980 – 65,326 – – 130,654 195,980 195,980 06.01.2009-06.01.2011
SAR 09/10 3.88 – 263,796 – – – 263,796 263,796 263,796 08.07.2010-08.07.2012
SAR 09/10 4.47 – 38,163 – – – 38,163 38,163 38,163 11.30.2010-11.30.2012
RSU 07/08 5.14 33,767 – 16,883 – – 16,884 16,884 16,884 09.01.2008-09.01.2010
RSU 08/09 5.88 78,390 – 26,130 – – 52,260 52,260 52,260 06.01.2009-06.01.2011
RSU 09/10 3.88 – 119,907 – – – 119,907 119,907 119,907 08.07.2010-08.07.2012
RSU 09/10 4.47 – 17,347 – – – 17,347 17,347 17,347 11.30.2010-11.30.2012
Mr. Nicholas C. Allen SAR 09/10 4.47 – 107,343 – – – 107,343 107,343 107,343 11.30.2010–11.30.2012
RSU 09/10 4.47 – 48,792 – – – 48,792 48,792 48,792 11.30.2010–11.30.2012
Note 1: Proceeds in respect of quarterly deferral grants to be paid only at point of termination from the board of directors or unforeseen emergency.
Note 2: Dividends paid with respect to eligible deferral grants.
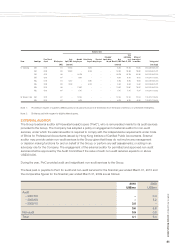
EXTERNAL AUDITOR
The Group’s external auditor is PricewaterhouseCoopers (“PwC”), who is remunerated mainly for its audit services
provided to the Group. The Company has adopted a policy on engagement of external auditor for non-audit
services, under which the external auditor is required to comply with the independence requirements under Code
of Ethics for Professional Accountants issued by Hong Kong Institute of Certified Public Accountants. External
auditor may provide certain non-audit services to the Group given that these do not involve any management
or decision making functions for and on behalf of the Group; or perform any self assessments; or acting in an
advocacy role for the Company. The engagement of the external auditor for permitted and approved non-audit
services shall be approved by the Audit Committee if the value of such non-audit services equals to or above
US$320,000.
During the year, PwC provided audit and insignificant non-audit services to the Group.
The fees paid or payable to PwC for audit and non-audit services for the financial year ended March 31, 2010 and
the comparative figures for the financial year ended March 31, 2009 are as follows:
2010 2009
US$mn US$mn
Audit
– 2007/08 – 0.4
– 2008/09 – 5.2
– 2009/10 3.6 –
3.6 5.6
Non-audit 0.5 0.8
Total 4.1 6.4