Lenovo 2010 Annual Report Download - page 77
Download and view the complete annual report
Please find page 77 of the 2010 Lenovo annual report below. You can navigate through the pages in the report by either clicking on the pages listed below, or by using the keyword search tool below to find specific information within the annual report.-
 1
1 -
2
-
3
-
4
-
5
-
6
-
7
-
8
-
9
-
10
-
11
-
12
-
13
-
14
-
15
-
16
-
17
-
18
-
19
-
20
-
21
-
22
-
23
-
24
-
25
-
26
-
27
-
28
-
29
-
30
-
31
-
32
-
33
-
34
-
35
-
36
-
37
-
38
-
39
-
40
-
41
-
42
-
43
-
44
-
45
-
46
-
47
-
48
-
49
-
50
-
51
-
52
-
53
-
54
-
55
-
56
-
57
-
58
-
59
-
60
-
61
-
62
-
63
-
64
-
65
-
66
-
 67
67 -
 68
68 -
 69
69 -
 70
70 -
 71
71 -
 72
72 -
 73
73 -
 74
74 -
 75
75 -
 76
76 -
 77
77 -
 78
78 -
 79
79 -
 80
80 -
 81
81 -
 82
82 -
 83
83 -
 84
84 -
 85
85 -
 86
86 -
 87
87 -
88
-
89
-
90
-
91
-
92
-
93
-
94
-
95
-
96
-
97
-
98
-
99
-
100
-
101
-
102
-
103
-
104
-
105
-
106
-
107
-
108
-
109
-
110
-
111
-
112
-
113
-
114
-
115
-
116
-
117
-
118
-
119
-
120
-
121
-
122
-
123
-
124
-
125
-
126
-
127
-
128
-
129
-
130
-
131
-
132
-
133
-
134
-
135
-
136
-
137
-
138
-
139
-
140
-
141
-
142
-
143
-
144
-
145
-
146
-
147
-
148
-
149
-
150
-
151
-
152
 |
 |

2009/10 Annual Report Lenovo Group Limited
75
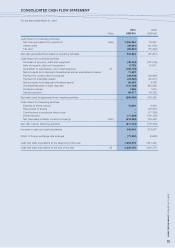
CONSOLIDATED CASH FLOW STATEMENT
For the year ended March 31, 2010
2010 2009
Note US$’000 US$’000
Cash flows from operating activities
Net cash generated from operations 35(a) 1,060,364 19,961
Interest paid (59,891) (41,976)
Tax paid (82,231) (75,292)
Net cash generated from/(used in) operating activities 918,242 (97,307)
Cash flows from investing activities
Purchase of property, plant and equipment (36,144) (107,016)
Sale of property, plant and equipment 8,762 10,671
Acquisition of subsidiaries, net of cash acquired 37 (106,704) –
Net proceeds from disposal of subsidiaries and an associated company 11,982 –
Payment for construction-in-progress (39,979) (63,988)
Payment for intangible assets (32,320) (22,911)
Net proceeds from disposal of financial assets 89,538 9,788
(Increase)/decrease in bank deposits (172,126) 540,058
Dividend received 1,558 1,515
Interest received 20,377 64,126
Net cash (used in)/generated from investing activities (255,056) 432,243
Cash flows from financing activities
Exercise of share options 13,640 9,433
Repurchase of shares – (53,907)
Contributions to employee share trusts – (17,169)
Dividends paid (11,896) (179,159)
Net (decrease)/increase in bank borrowings 35(b) (218,884) 124,493
Net cash used in financing activities (217,140) (116,309)
Increase in cash and cash equivalents 446,046 218,627
Effect of foreign exchange rate changes (71,230) (6,668)
Cash and cash equivalents at the beginning of the year 1,863,379 1,651,420
Cash and cash equivalents at the end of the year 25 2,238,195 1,863,379