Lenovo 2010 Annual Report Download - page 26
Download and view the complete annual report
Please find page 26 of the 2010 Lenovo annual report below. You can navigate through the pages in the report by either clicking on the pages listed below, or by using the keyword search tool below to find specific information within the annual report.-
 1
1 -
2
-
3
-
4
-
5
-
6
-
7
-
8
-
9
-
10
-
11
-
12
-
13
-
14
-
15
-
 16
16 -
 17
17 -
 18
18 -
 19
19 -
 20
20 -
 21
21 -
 22
22 -
 23
23 -
 24
24 -
 25
25 -
 26
26 -
 27
27 -
 28
28 -
 29
29 -
 30
30 -
 31
31 -
 32
32 -
 33
33 -
 34
34 -
 35
35 -
 36
36 -
37
-
38
-
39
-
40
-
41
-
42
-
43
-
44
-
45
-
46
-
47
-
48
-
49
-
50
-
51
-
52
-
53
-
54
-
55
-
56
-
57
-
58
-
59
-
60
-
61
-
62
-
63
-
64
-
65
-
66
-
67
-
68
-
69
-
70
-
71
-
72
-
73
-
74
-
75
-
76
-
77
-
78
-
79
-
80
-
81
-
82
-
83
-
84
-
85
-
86
-
87
-
88
-
89
-
90
-
91
-
92
-
93
-
94
-
95
-
96
-
97
-
98
-
99
-
100
-
101
-
102
-
103
-
104
-
105
-
106
-
107
-
108
-
109
-
110
-
111
-
112
-
113
-
114
-
115
-
116
-
117
-
118
-
119
-
120
-
121
-
122
-
123
-
124
-
125
-
126
-
127
-
128
-
129
-
130
-
131
-
132
-
133
-
134
-
135
-
136
-
137
-
138
-
139
-
140
-
141
-
142
-
143
-
144
-
145
-
146
-
147
-
148
-
149
-
150
-
151
-
152
 |
 |

2009/10 Annual Report Lenovo Group Limited
24
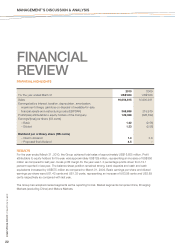
MANAGEMENT’S DISCUSSION & ANALYSIS
CAPITAL EXPENDITURE
The Group incurred capital expenditures of US$108 million (2009: US$194 million) during the year, mainly for
the acquisition of marketing rights, property, plant and equipment, completion of construction-in-progress and
investments in the Group’s information technology systems.
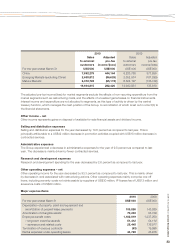
LIQUIDITY AND FINANCIAL RESOURCES
At March 31, 2010, total assets of the Group amounted to US$8,956 million (2009: US$6,622 million), which were
financed by equity attributable to owners of the Company of US$1,606 million (2009: US$1,311 million), minority
interests of US$177,000 (2009: US$177,000), and non-current and current liabilities of US$7,350 million (2009:
US$5,311 million). At March 31, 2010, the current ratio of the Group was 0.97 (2009: 0.92).
The Group had a solid financial position and continued to maintain a strong and steady cash inflow from its
operating activities. At March 31, 2010, bank deposits, cash and cash equivalents totaled US$2,439 million (2009:
US$1,863 million), of which 42.9 (2009: 65.7) percent was denominated in US dollars, 46.6 (2009: 24.5) percent in
Renminbi, 1.6 (2009: 2.8) percent in Euros, 0.2 (2009: 1.9) percent in Japanese Yen, and 8.7 (2009: 5.1) percent
in other currencies.
The Group adopts a conservative policy to invest the surplus cash generated in the operations. At March 31,
2010, 78.2 (2009: 81.0) percent of cash are bank deposits, and 21.8 (2009: 19.0) percent of cash are investments
in liquid money market fund of investment grade.
Although the Group has consistently maintained a very liquid position, banking facilities have nevertheless been put
in place for contingency purposes. At March 31, 2010, the Group had a US$200 million 5-Year revolving and term
loan facility with syndicated banks; and a US$30 million 5-Year fixed rate loan facility with a bank in China. These
facilities were fully utilized at March 31, 2010 and both of which will expire before the end of March 2011.
To secure more long-term funding, the Group obtained a new US$300 million 3-year term loan facility with a
bank in China in March 2009. This facility was utilized to the extent of US$200 million at March 31, 2010 (2009:
US$200 million). In addition, the Group has entered into another 5 years loan facility agreement with a bank of
US$300 million on July 17, 2009. The Group is confident that all the loan facilities on hand can meet the funding
requirements of the Group’s operations and business development.
The Group has also arranged other short-term credit facilities. At March 31, 2010, the Group’s total available credit
facilities amounted to US$4,936 million (2009: US$4,210 million), of which US$276 million (2009: US$279 million)
was in trade lines, US$485 million (2009: US$498 million) in short-term and revolving money market facilities and
US$4,175 million (2009: US$3,433 million) in forward foreign exchange contracts. At March 31, 2010, the amounts
drawn down were US$191 million (2009: US$91 million) in trade lines, US$2,641 million (2009: US$1,964 million)
being used for the forward foreign exchange contracts; and US$65 million (2009: US$20 million) in short-term
bank loans.
At March 31, 2010, the Group’s outstanding bank loans represented the term loans of US$430 million (2009:
US$665 million) and short-term bank loans of US$65 million (2009: US$20 million). Short-term bank loans of
US$28 million are secured by the same amount of bank deposits. When compared with total equity of US$1,606
million (2009: US$1,311 million), the Group’s gearing ratio was 0.31 (2009: 0.52). The net cash position of the
Group at March 31, 2010 is US$1,944 million (2009: US$1,178 million).