Lenovo 2010 Annual Report Download - page 114
Download and view the complete annual report
Please find page 114 of the 2010 Lenovo annual report below. You can navigate through the pages in the report by either clicking on the pages listed below, or by using the keyword search tool below to find specific information within the annual report.-
 1
1 -
2
-
3
-
4
-
5
-
6
-
7
-
8
-
9
-
10
-
11
-
12
-
13
-
14
-
15
-
16
-
17
-
18
-
19
-
20
-
21
-
22
-
23
-
24
-
25
-
26
-
27
-
28
-
29
-
30
-
31
-
32
-
33
-
34
-
35
-
36
-
37
-
38
-
39
-
40
-
41
-
42
-
43
-
44
-
45
-
46
-
47
-
48
-
49
-
50
-
51
-
52
-
53
-
54
-
55
-
56
-
57
-
58
-
59
-
60
-
61
-
62
-
63
-
64
-
65
-
66
-
67
-
68
-
69
-
70
-
71
-
72
-
73
-
74
-
75
-
76
-
77
-
78
-
79
-
80
-
81
-
82
-
83
-
84
-
85
-
86
-
87
-
88
-
89
-
90
-
91
-
92
-
93
-
94
-
95
-
96
-
97
-
98
-
99
-
100
-
101
-
102
-
103
-
 104
104 -
 105
105 -
 106
106 -
 107
107 -
 108
108 -
 109
109 -
 110
110 -
 111
111 -
 112
112 -
 113
113 -
 114
114 -
 115
115 -
 116
116 -
 117
117 -
 118
118 -
 119
119 -
 120
120 -
 121
121 -
 122
122 -
 123
123 -
 124
124 -
125
-
126
-
127
-
128
-
129
-
130
-
131
-
132
-
133
-
134
-
135
-
136
-
137
-
138
-
139
-
140
-
141
-
142
-
143
-
144
-
145
-
146
-
147
-
148
-
149
-
150
-
151
-
152
 |
 |

2009/10 Annual Report Lenovo Group Limited
112
NOTES TO THE FINANCIAL STATEMENTS (continued)
112
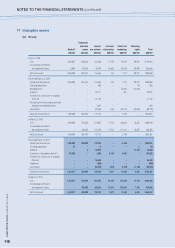
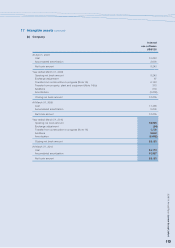
17 Intangible assets
(a) Group
Trademarks
and trade Internal Customer Patent and Marketing
Goodwill names use software relationships technology rights Total
US$’000 US$’000 US$’000 US$’000 US$’000 US$’000 US$’000
At April 1, 2008
Cost 1,300,837 525,305 161,038 17,023 92,220 98,001 2,194,424
Accumulated amortization
and impairment losses 3,899 145,305 45,492 16,863 85,008 59,489 356,056
Net book amount 1,296,938 380,000 115,546 160 7,212 38,512 1,838,368
Year ended March, 31 2009
Opening net book amount 1,296,938 380,000 115,546 160 7,212 38,512 1,838,368
Exchange adjustment – – 463 – 1 118 582
Reclassification – – – – 20,000 (20,000) –
Additions – – 22,011 – 900 – 22,911
Transfer from construction-in-progress
(Note 16) – – 67,109 – – – 67,109
Reclassification from property, plant and
equipment and deferred assets – – 7,620 – – – 7,620
Amortization – – (42,025) (160) (22,914) (18,630) (83,729)
Closing net book amount 1,296,938 380,000 170,724 – 5,199 – 1,852,861
At March 31, 2009
Cost 1,296,938 516,352 272,922 17,000 106,620 78,337 2,288,169
Accumulated amortization
and impairment losses – 136,352 102,198 17,000 101,421 78,337 435,308
Net book amount 1,296,938 380,000 170,724 – 5,199 – 1,852,861
Year ended March, 31 2010
Opening net book amount 1,296,938 380,000 170,724 – 5,199 – 1,852,861
Exchange adjustment 27 – 8 – – 4 39
Additions – 3 20,607 – – 11,710 32,320
Acquisition of subsidiaries (Note 37) 176,552 – 1,624 8,184 8,460 – 194,820
Transfer from construction-in-progress
(Note 16) – – 56,499 – – – 56,499
Impairment – – (859) – – – (859)
Amortization – – (60,479) (513) (1,195) (7,156) (69,343)
Closing net book amount 1,473,517 380,003 188,124 7,671 12,464 4,558 2,066,337
At March 31, 2010
Cost 1,473,517 516,355 351,470 25,184 115,080 11,719 2,493,325
Accumulated amortization
and impairment losses – 136,352 163,346 17,513 102,616 7,161 426,988
Net book amount 1,473,517 380,003 188,124 7,671 12,464 4,558 2,066,337