Lenovo 2010 Annual Report Download - page 111
Download and view the complete annual report
Please find page 111 of the 2010 Lenovo annual report below. You can navigate through the pages in the report by either clicking on the pages listed below, or by using the keyword search tool below to find specific information within the annual report.-
 1
1 -
2
-
3
-
4
-
5
-
6
-
7
-
8
-
9
-
10
-
11
-
12
-
13
-
14
-
15
-
16
-
17
-
18
-
19
-
20
-
21
-
22
-
23
-
24
-
25
-
26
-
27
-
28
-
29
-
30
-
31
-
32
-
33
-
34
-
35
-
36
-
37
-
38
-
39
-
40
-
41
-
42
-
43
-
44
-
45
-
46
-
47
-
48
-
49
-
50
-
51
-
52
-
53
-
54
-
55
-
56
-
57
-
58
-
59
-
60
-
61
-
62
-
63
-
64
-
65
-
66
-
67
-
68
-
69
-
70
-
71
-
72
-
73
-
74
-
75
-
76
-
77
-
78
-
79
-
80
-
81
-
82
-
83
-
84
-
85
-
86
-
87
-
88
-
89
-
90
-
91
-
92
-
93
-
94
-
95
-
96
-
97
-
98
-
99
-
100
-
 101
101 -
 102
102 -
 103
103 -
 104
104 -
 105
105 -
 106
106 -
 107
107 -
 108
108 -
 109
109 -
 110
110 -
 111
111 -
 112
112 -
 113
113 -
 114
114 -
 115
115 -
 116
116 -
 117
117 -
 118
118 -
 119
119 -
 120
120 -
 121
121 -
122
-
123
-
124
-
125
-
126
-
127
-
128
-
129
-
130
-
131
-
132
-
133
-
134
-
135
-
136
-
137
-
138
-
139
-
140
-
141
-
142
-
143
-
144
-
145
-
146
-
147
-
148
-
149
-
150
-
151
-
152
 |
 |

2009/10 Annual Report Lenovo Group Limited
109109
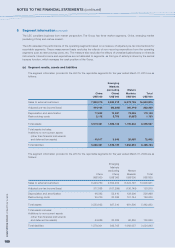
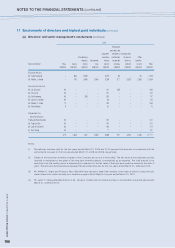
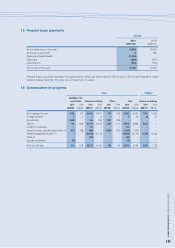
14 Property, plant and equipment
(a) Group
Leasehold Plant Furniture
improve- and and Office Motor
Buildings ments machinery fixtures equipment vehicles Total
US$’000 US$’000 US$’000 US$’000 US$’000 US$’000 US$’000
At April 1, 2008
Cost 112,494 74,347 181,406 40,581 233,823 3,730 646,381
Accumulated depreciation 20,810 37,043 86,369 10,901 124,023 2,457 281,603
Net book amount 91,684 37,304 95,037 29,680 109,800 1,273 364,778
Year ended March 31, 2009
Opening net book amount 91,684 37,304 95,037 29,680 109,800 1,273 364,778
Exchange adjustment 1,105 (603) 2,333 (2,114) (171) 36 586
Additions 1,466 8,660 49,152 6,613 40,863 262 107,016
Transfer from construction-in-progress
(Note 16) 62 388 378 – 252 – 1,080
Disposals – (146) (2,251) (709) (6,810) (290) (10,206)
Reclassification to intangible assets – – – – (5,997) – (5,997)
Depreciation (3,045) (11,809) (76,812) (4,998) (46,123) (328) (143,115)
Closing net book amount 91,272 33,794 67,837 28,472 91,814 953 314,142
At March 31, 2009
Cost 115,948 74,761 226,812 43,096 223,217 2,318 686,152
Accumulated depreciation 24,676 40,967 158,975 14,624 131,403 1,365 372,010
Net book amount 91,272 33,794 67,837 28,472 91,814 953 314,142
Year ended March 31, 2010
Opening net book amount 91,272 33,794 67,837 28,472 91,814 953 314,142
Exchange adjustment 756 (1,371) 8,642 4,224 (9,676) (34) 2,541
Reclassification (2,536) 482 (10,553) (5,658) 18,265 – –
Additions 337 5,410 9,984 1,065 19,092 256 36,144
Acquisition of subsidiaries (Note 37) – 7,028 5,010 26 3,974 682 16,720
Transfer from construction-in-progress
(Note 16) 337 1,970 564 471 1,816 – 5,158
Disposals of subsidiaries (7,523) (1) (305) (3) (323) – (8,155)
Disposals – (2,744) (2,670) (1,501) (4,815) (93) (11,823)
Impairment (74) (73) (1,061) (98) (4,385) (74) (5,765)
Depreciation (2,801) (9,614) (41,622) (6,638) (39,742) (284) (100,701)
Closing net book amount 79,768 34,881 35,826 20,360 76,020 1,406 248,261
At March 31, 2010
Cost 102,020 88,815 214,617 38,646 252,781 3,244 700,123
Accumulated depreciation 22,252 53,934 178,791 18,286 176,761 1,838 451,862
Net book amount 79,768 34,881 35,826 20,360 76,020 1,406 248,261