Lenovo 2010 Annual Report Download - page 138
Download and view the complete annual report
Please find page 138 of the 2010 Lenovo annual report below. You can navigate through the pages in the report by either clicking on the pages listed below, or by using the keyword search tool below to find specific information within the annual report.-
 1
1 -
 2
2 -
 3
3 -
 4
4 -
 5
5 -
 6
6 -
 7
7 -
 8
8 -
 9
9 -
 10
10 -
 11
11 -
 12
12 -
 13
13 -
 14
14 -
 15
15 -
 16
16 -
 17
17 -
 18
18 -
 19
19 -
 20
20 -
 21
21 -
 22
22 -
 23
23 -
 24
24 -
 25
25 -
 26
26 -
 27
27 -
 28
28 -
 29
29 -
 30
30 -
 31
31 -
 32
32 -
 33
33 -
 34
34 -
 35
35 -
 36
36 -
 37
37 -
 38
38 -
 39
39 -
 40
40 -
 41
41 -
 42
42 -
 43
43 -
 44
44 -
 45
45 -
 46
46 -
 47
47 -
 48
48 -
 49
49 -
 50
50 -
 51
51 -
 52
52 -
 53
53 -
 54
54 -
 55
55 -
 56
56 -
 57
57 -
 58
58 -
 59
59 -
 60
60 -
 61
61 -
 62
62 -
 63
63 -
 64
64 -
 65
65 -
 66
66 -
 67
67 -
 68
68 -
 69
69 -
 70
70 -
 71
71 -
 72
72 -
 73
73 -
 74
74 -
 75
75 -
 76
76 -
 77
77 -
 78
78 -
 79
79 -
 80
80 -
 81
81 -
 82
82 -
 83
83 -
 84
84 -
 85
85 -
 86
86 -
 87
87 -
 88
88 -
 89
89 -
 90
90 -
 91
91 -
 92
92 -
 93
93 -
 94
94 -
 95
95 -
 96
96 -
 97
97 -
 98
98 -
 99
99 -
 100
100 -
 101
101 -
 102
102 -
 103
103 -
 104
104 -
 105
105 -
 106
106 -
 107
107 -
 108
108 -
 109
109 -
 110
110 -
 111
111 -
 112
112 -
 113
113 -
 114
114 -
 115
115 -
 116
116 -
 117
117 -
 118
118 -
 119
119 -
 120
120 -
 121
121 -
 122
122 -
 123
123 -
 124
124 -
 125
125 -
 126
126 -
 127
127 -
 128
128 -
 129
129 -
 130
130 -
 131
131 -
 132
132 -
 133
133 -
 134
134 -
 135
135 -
 136
136 -
 137
137 -
 138
138 -
 139
139 -
 140
140 -
 141
141 -
 142
142 -
 143
143 -
 144
144 -
 145
145 -
 146
146 -
 147
147 -
 148
148 -
 149
149 -
 150
150 -
 151
151 -
 152
152
 |
 |

2009/10 Annual Report Lenovo Group Limited
136
NOTES TO THE FINANCIAL STATEMENTS (continued)
136
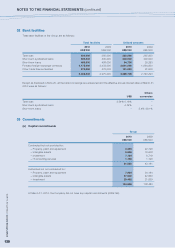
32 Bank facilities
Total bank facilities of the Group are as follows:
Total facilities Utilized amounts
2010 2009 2010 2009
US$’000 US$’000 US$’000 US$’000
Term loan 330,000 365,000 230,000 265,000
Short-term syndicated loans 200,000 400,000 200,000 400,000
Short-term loans 485,000 498,000 64,706 20,293
Forward foreign exchange contracts 4,175,000 3,433,000 2,641,000 1,964,000
Other trade finance facilities 276,000 279,000 191,000 91,000
5,466,000 4,975,000 3,326,706 2,740,293
Except as disclosed in Note 25, all the bank borrowings are unsecured and the effective annual interest rates at March 31,
2010 were as follows:
Others
US$ currencies
Term loan 3.54%-5.16% –
Short-term syndicated loans 4.74% –
Short-term loans – 5.4%-30.1%
33 Commitments
(a) Capital commitments
Group
2010 2009
US$’000 US$’000
Contracted but not provided for:
– Property, plant and equipment 3,235 22,728
– Intangible assets 9,998 10,608
– Investment 7,184 8,719
– IT consulting services 1,163 1,126
21,580 43,181
Authorized but not contracted for:
– Property, plant and equipment 7,924 34,184
– Intangible assets 67,602 42,660
– Investment 29,462 31,639
104,988 108,483
At March 31, 2010, the Company did not have any capital commitments (2009: Nil).
